Repository navigation
Memory leak in garbage collector, not running generation collection #98801

Description

Bug report
We're encountering memory growth in a pytorch training application (which we cannot share). The observation: Although the number of live objects does not increase (verified by running gc.collect(), print(len(gc.get_objects()))), and also the number of torch objects and their total size remain constant, the memory increases every iteration, from 2GB initially to 60GB after a few iterations. Nevertheless, tracemalloc was reporting increasing number of objects. Finally, we found that gc.get_count() is increasing in generation 2: gc.get_count() -> (347, 2, 247) (third number slowly increasing). Although, after running gc.collect(), a lot of memory was actually freed. By adding a print hook to the gc gc.callbacks.append(lambda phase, info: info["generation"] >= 2 and print(f"GC: {phase} {info}, {gc.get_count()}")), we found that gen2 is actually never being called.
Good Example (shows the problem)
See this post: #98801 (comment)
Original Example (better ignore this, it's not really showing the problem)
Trying to reproduce this as a minimal example proves hard, there is a lot of interaction happening with pytorch and dataloading, etc. Nevertheless, here is a small example which reproduces something similar: It might not be "minimal", but at least it's small:
import gc


class Island:
    def __init__(self):
        # Important, this causes the object to create a gc island.
        self.self = self
        # To show the memory increase stronger, allocate something large
        self.memory = b'0' * 1024 * 1024


def gc_island():
    # Prevent the large object "gc island" from being collected (store it in x)
    x = Island()
    # This is key to reproducing the error. It does not clean up anything. Probably, in the full
    # training code this must somehow be triggered implicitly by some random situation?
    gc.collect(1)


# Hook for the gc, which logs when generation 2 gc is triggered
def gc_cb(phase, info):
    if info["generation"] >= 2:  # set to the gen you want to log
        print(f"GC: {phase} {info}, {gc.get_count()}")


def main():
    # initial cleanup. Just to be sure
    gc.collect()
    # Logging the gc gen2 collection
    gc.callbacks.append(gc_cb)

    # Iterate the gc_island() to create the leak.
    # Increase this to any number, memory will increase 500 * iteration until gc.collect(2) is
    # called (then it is reset to initial usage).
    for i in range(500):
        gc_island()
        if i % 100 == 0:
            print(f"{i}: GC: {gc.get_count()}")

    # Print current counter.
    print(f"GC: {gc.get_count()}")
    # Run collect(2) to actually free the memory
    print("gc.collect()")
    print(f"-> {gc.collect()}")
    # Now, memory is freed. But why was gc.collect(2) never called automatically?
    print(f"GC: {gc.get_count()}")

    print("exit")


if __name__ == "__main__":
    main()
Output:
0: GC: (0, 0, 1)
100: GC: (0, 0, 101)
200: GC: (0, 0, 201)
300: GC: (0, 0, 301)
400: GC: (0, 0, 401)
GC: (0, 0, 500)
gc.collect()
GC: start {'generation': 2, 'collected': 0, 'uncollectable': 0}, (0, 0, 500)
GC: stop {'generation': 2, 'collected': 1000, 'uncollectable': 0}, (1, 0, 0)
-> 1000
GC: (2, 0, 0)
exit
GC: start {'generation': 2, 'collected': 0, 'uncollectable': 0}, (0, 0, 0)
GC: stop {'generation': 2, 'collected': 0, 'uncollectable': 0}, (1, 0, 0)
Your environment
- CPython versions tested on: 3.8.10, 3.10.7
- Operating system and architecture: Windows 8, Ubuntu on WSL, Ubuntu (bare metal) with Docker
Activity
philipp-fischer commentedon Nov 2, 2022
@tim-one
Yes we have seen the code in https://github.com/python/cpython/blob/main/Modules/gcmodule.c#L1455 but didn't see how this would impact collection in our case.
pablogsal commentedon Nov 2, 2022
I made a simple check, added:
after the last
gc.collect()shows that noIslandobjects remain alive at the end of the program.pablogsal commentedon Nov 2, 2022
Also, between collections, seems that the only objects that survive the island object on the stack and the index tuple:
and that immediately goes away in the next gc run.
nascheme commentedon Nov 2, 2022
For the second demo problem, it looks to me like the problem is that collection of generation 2 (i.e. full collection) is never triggered until the end of the program. Occasionally an
Islandinstance survives a non-full collection, kept alive somehow. Probably referenced by a local variable or function parameter. E.g. if collection happens whileIsland.__init__is running.I don't yet see a bug here. The original issue is that you call
gc.collect(1)which results in a full collection never getting triggered.pablogsal commentedon Nov 2, 2022
That's the reference on the ceval stack, is the one that I see surviving the collection on every generation (until it dies later).
Jason-Y-Z commentedon Nov 2, 2022
Thanks Pablo and @nascheme , (sorry if I misunderstood you but) as Lukas @voegtlel mentioned -
I think the main concern here was that there were too many (compared with the threshold) intermediate objects alive in the last generation before the final
gc.collect()gets run.Jason-Y-Z commentedon Nov 2, 2022
Yes, that was my initial reply as well, but Lukas clarified that they were aware of this.
pablogsal commentedon Nov 2, 2022
I can always account for all objects as well:
pablogsal commentedon Nov 2, 2022
I am seeing full collections before the end of the program:
I get this:
pablogsal commentedon Nov 2, 2022
Ah, but those happen on teardown. Let me investigate why the second generation was never triggered
pablogsal commentedon Nov 2, 2022
The reason is that every time the last generation is considered the counts are:
So the condition
ling_lived_pending >= long_lived_total / 4is never true.In other words, the number objects being promoted to the next generation is always constant (440) when they go from 1st to 2nd, while the objects in the last generation when that was collected are always 4k. This means that not enough objects manage to survive collections until they reach the final generation to trigger a full collection.
pablogsal commentedon Nov 2, 2022
Notice that the threshold of the last generation is just a first-measure pass, if you make it too small you still need to manage to get the
ling_lived_pending >= long_lived_total / 4to be true.nascheme commentedon Nov 2, 2022
The GC collection threshold mechanism is based on the assumption that used memory is proportional to the number of Python objects allocated. CPython doesn't track bytes allocated, for example. I suspect that assumption is not a good one for your pytorch application. Probably large chunks of memory are consumed by things other than Python objects.
Adding explicit calls to
gc.collect()(full collection) might fix it. I'd suggest a better fix is to not create the reference cycles in the first place (maybe hard to do) or to manually tear them down, maybe with a context handler or something similar. If you are going to manually callgc.collect()or lower the thresholds, it would be a good idea to look intogc.freeze(). That could make full collection a lot cheaper.If you want to avoid the reference cycles, using
gc.DEBUG_LEAKandgc.get_referrers()could be helpful. If the object reference graph is complex, it can be really hard to debug though. Perhaps you have only a few things that are consuming most of the memory and then you can track down what is keeping those alive.pablogsal commentedon Nov 2, 2022
Indeed, to complete @nascheme's words, here is the rough summary of what's going on with this reproducer:
pablogsal commentedon Nov 2, 2022
Indeed, consider this:
This prints:
And this grows unbounded and without control.
philipp-fischer commentedon Nov 2, 2022
@nascheme
We are not looking for a workaround or fix for our program (we already have
gc.collectin place for that) but we are looking to fix cpython itself. Our application is by no means special and the cyclic reference is indeed a useful one and it's needed.So memory should not explode if cpython works as expected
pablogsal commentedon Nov 2, 2022
Don't worry, if this is something worth fixing in CPython we will get it fixed 👍
philipp-fischer commentedon Nov 2, 2022
Just wanted to add that our original full pytorch code which shows the indefinite memory growth does not mess with the GC in any way (no
gc.collectorgc.set_thresholdor anything fromimport gc).Those things were only added later for debugging.
pablogsal commentedon Nov 2, 2022
I assume this is more common if your thresholds are very small or you create objects very slowly that mostly are cycles. Here is a plot of how the following code grows the last generation (the last fall is the interpreter stoping on Ctrl-C):
But this is how the following program grows (the last fall is the interpreter stoping on Ctrl-C):
Is unclear to me if there is a way to get this behaviour with some weird allocation patterns without using
gc.collect(1)but I think is possible to get promotions to the last gen one at a time through some similar process.pablogsal commentedon Nov 2, 2022
Yeah, see this part of my latest comment:
I think a variation of this reproducer can be made without explicitly calling
gc.collect()but it will require some more involved patterns.philipp-fischer commentedon Nov 2, 2022
Did you try the example from #98801 (comment) ?
This one does not have
gc.collect()in the loop and still keeps growing.pablogsal commentedon Nov 2, 2022
Yeah, I did and is not enough. This is the grow pattern of that example:
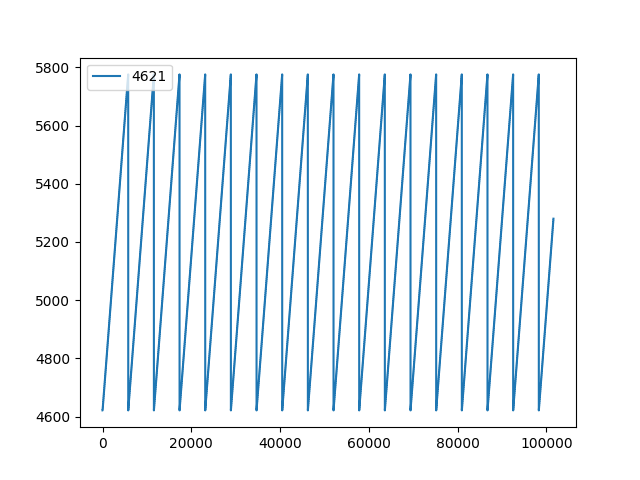
pablogsal commentedon Nov 2, 2022
These plots show the size of the last generation
pablogsal commentedon Nov 2, 2022
@tim-one @nascheme I think we should have another limit here: the maximum numbers in the last gen that if surpassed, will trigger a collection. This number is like the threshold of the last gen except is dynamic: when a collection of the last gen finishes, is updated to
new_number = max(HARDCODED_MAYBE_TUNABLE_BIG_NUMBER, last_gen_survivors).So a collection is triggered
and
long_lived_pending >= long_lived_total / 4is met.This preserves non-quadratic collections because if the last gen is full of stubborn objects that refuse to die, the magic number I am proposing grows with them, but if collectable objects are slowly promoted to the last gen unbounded, the collection will trigger at some point and the number will be lowered to the number of survivors.
I will prepare a PR unless you have any reservations and want to discuss more.
philipp-fischer commentedon Nov 2, 2022
How do we pick the
HARDCODED_MAYBE_TUNABLE_BIG_NUMBER?pablogsal commentedon Nov 2, 2022
The default will be some number obtained by the use of very complicated arcane rituals (don't expect anything extremely scientific: we will choose a number that we happen to like and we think is not going to impact most applications - same way the default thresholds were chosen) but the important part is that it will be tunable, so if you don't like the default, you can choose your own.
philipp-fischer commentedon Nov 2, 2022
:'D
philipp-fischer commentedon Nov 2, 2022
Interestingly, for me the example works and gen2 objects increase steadily
pablogsal commentedon Nov 2, 2022
What Python are you using? I am using 3.10.8
philipp-fischer commentedon Nov 2, 2022
Earlier I had run this with 3.10.6, now I'm on a different machine and with Python 3.9.0
pablogsal commentedon Nov 2, 2022
Ah, I noticed I commented out the big string because that's not doing anything in the cycle. Can you check what happens if you comment out this line:
philipp-fischer commentedon Nov 2, 2022
Runs much quicker and still shows object count growth
pablogsal commentedon Nov 2, 2022
I'm trying 3.10.6 (on macOS) and I cannot reproduce it. It doesn't grow as you say. I suppose something else is at play here in your case because I am compiling these versions from the source every time so they are as vanilla as it gets. I cannot what difference different OSes can make here.
Maybe the Python that you are using at the Pattern Recognition and Image Processing department is cursed ;)
pablogsal commentedon Nov 2, 2022
Are you using vanilla CPython or this is something you are getting from vendors (i.e. conda provided Python or similar)?
philipp-fischer commentedon Nov 2, 2022
We really have tried many different version and OSes. This is nothing special.
Right now it's this one:
3.9.0 (tags/v3.9.0:9cf6752, Oct 5 2020, 15:34:40) [MSC v.1927 64 bit (AMD64)]But let me get a recent vanilla one.
pablogsal commentedon Nov 2, 2022
Then I am afraid you are going to try to explain to me why if I execute that same code I don't get what you say :S
tim-one commentedon Nov 2, 2022
The original report seemed to be about "memory" use, but didn't say precisely how that was measured. There's no guarantee that CPython can return dynamic memory to C (at the CPython level this is at "arena" granularity, and a single live object in an arena keeps the entire arena alive),, and even when we do return memory to C, there's no guarantee that the platform C will in turn return it to "the system" in a way that shows up in whatever system tool(s) are used to measure.
pablogsal commentedon Nov 2, 2022
Yeah, but that sentence was about the discussion regarding the fact that this reproducer:
#98801 (comment)
for me doesn't grow the last generation over time but for @philipp-fischer apparently does.
philipp-fischer commentedon Nov 2, 2022
Ok I ran the exact code from the above example with
3.10.7 (tags/v3.10.7:6cc6b13, Sep 5 2022, 14:08:36) [MSC v.1933 64 bit (AMD64)]and see output like
@voegtlel has also tried with a few versions (see initial post)
pablogsal commentedon Nov 2, 2022
Yeah, but doesn't it work arbitrarily or not? I can see that output but never grows above ~6k
philipp-fischer commentedon Nov 2, 2022
We understand that. We noticed the issue by growing memory (up to hundreds of GB and operating system killing the process due to out of memory).
But the issue in cpython should be measured in object count not gigabytes.
pablogsal commentedon Nov 2, 2022
@philipp-fischer Can you try to run with
python -I?philipp-fischer commentedon Nov 2, 2022
Still the same in isolated mode
philipp-fischer commentedon Nov 2, 2022
Have you tried a release build instead of built from source?
pablogsal commentedon Nov 2, 2022
Yep. I have tried using Arch Linux current python (3.10.8) with the same behaviour.
I suppose the only thing left is for you to give me a docker container that reproduces this.
pablogsal commentedon Nov 2, 2022
Also, please check this comment:
#98801 (comment)
To ensure that you are not seeing just a bigger bound, please make the loop much bigger:
and check that indeed it keeps growing (remove the big string so you don't need to wait for ages).
nascheme commentedon Nov 2, 2022
The
gcstate->long_lived_pendingcount does not get reset until a full collection happens. So, I don't see how adding objects slowly to the final generation would prevent a full collection from happening indefinitely.Edit: to be clear, long_lived_pending should be a count of the number of objects promoted into the final generation since the last full collection.
The comment in the source code is:
My reservation about a PR to change this would be a fear of re-introducing "dramatic performance
degradation in workloads which consist in creating and storing lots of long-lived objects".
pablogsal commentedon Nov 2, 2022
Run this:
Example:
nascheme commentedon Nov 2, 2022
I believe adding
gc.collect(1)is what causes that behaviour. The young generations stay small and a full collection never gets automatically triggered. For the pytorch program in the original report, they say they don't call gc.collect() or tweak anything using the gc module.pablogsal commentedon Nov 2, 2022
It may be possible to get similar behavior without
gc.collect(), which the OPs claim is what they see with their reproducer, but so far I cannot confirm it on my side.I suppose that until we confirm a reproducer that grows without control without using gc.collect() by hand then this should not be considered a bug.
pablogsal commentedon Nov 2, 2022
I'm removing the "bug" label until we can confirm a reproducer.
voegtlel commentedon Nov 3, 2022
Hi @pablogsal,
thanks for investigating! I agree with your analysis. I can reproduce with ~750.000 iterations in the loop, that gen2 collection is triggered. Exactly at 8092 objects in gen2 (= 6474 (initial number of objects in gen2 after first gc.collect()) * 1.25 which is the threshold of gen2 collection -> works as intended).
So, this mechanism works, but doesn't seem optimal to me, as we obviously actually run out of memory in terms of gigabytes, because our GC islands are quite huge (they are actually deeply nested NamedTuples) and this seems not to be captured? I fear our only solution options are:
gc.collectfromgc.callbacks)gc.collect()regularly manuallyAll of these options are workarounds, especially because I believe we're not doing something rare? Maybe it is because lots of nested
NamedTuples andlists instead of actual python objects are being used? If desired, I can try to repro this behavior (without the simple bytes object, but nested objects). I see why you don't want to change behavior of the gc, because it may have wide implications on other application's performance.pablogsal commentedon Nov 3, 2022
Hi @voegtlel and thanks for reporting back.
Ok, very good to know that this was indeed the case and I was not missing anything here.
Well, this has been mentioned several times in this thread so it should not come as news. The gc deals at the object level and knows nothing about memory. This has been explained by @nascheme here:
#98801 (comment)
and by Tim here:
#98801 (comment)
I was under the assumption that this was already a clear fact based on what your colleague acknowledged here:
#98801 (comment)
But it seems that you are talking about memory again because the cycles you create a point to a lot of memory.
From the point of view of the interpreter, everything is working as expected and this is not pointing to a bug. Unfortunately, there isn't much we can do on our side to improve the automatic management of your use case because the GC is oblivious to the memory content of an object. Notice that is not even as simple as calling
sys.getsizeofbecause objects can have arbitrary trees of objects held in strong references and some memory is not even visible to Python.Well, I would not say is rare, but certainly is not common. Having a lot of cycles where every cycle is pointing to a lot of memory is a very uncommon situation. So uncommon that this is the first time I remember someone coming to our bug tracker with this concern in 30 years.
I understand that you feel is not optimal because you are running out of memory, but is optimal given the constraints the GC needs to work on (number of objects and cycles). Discussing this area in this issue is not going to be productive for anyone so I won't elaborate more about this aspect.
The most obvious solution to me is to strategically call
gc.collect()or (better) useweakrefsto break the cycles or self-cycles so they get collected naturally by reference counting. Appart from that check @nascheme's advice here:#98801 (comment)
Thanks again for reaching out to us! I am closing this issue because is not a bug in the interpreter. If you discover new information, please feel free to reopen it, but you must attach a reproducer that can be run on any system (so we don't do the debugging dance again just to discover that the memory was not growing arbitrarily).
Adamantish commentedon Oct 19, 2026
@pablogsal I see your point that python's architecture can't easily support a perfect fix for this kind of problem. However...
For some reason that's no longer true. It seems to be affecting some very widely used libraries more often such as such as httpx, stdlib SSL, and I saw somewhere even in core python there was bug in async
TaskGroupthat had to be swiftly patched at one point.In my case, it was a slow moving problem in python 3.12 where httpx was tripling the heap size over the course of over an hour and would have hit OOM if I hadn't stepped in with a workaround fix. I just break the cyclic references after the request.
In a case like that, you could solve it even with some very loose hieuristic to check whether to trigger
gc.collect()every N minutes when there is more than X% heap growth (although I haven't dug into precisely whether 3.14 already does).I think this is perhaps a perfect storm that became a lot more common with AI orchestration workloads. These involve:
So I'm agreeing that, yes, it's not realistic to reimagine the whole GC to be based on based on byte counts rather than object counts, but why not as a relatively crude safety net? The scenario to fix is not really a tricky one: When there hasn't been enough object churn to apparently justify a
gc.collect()in a long time but if you just check the heap size growth every few minutes you can catch the case where that's not true. My sense is that it really doesn't need to be much more often so although it is a comparatively inefficient operation it would be negligible in its frequency.sergey-miryanov commentedon Oct 19, 2026
The PEP proposes a new incremental GC that relies on checking memory growth. Have you had a chance to look at it? What are your thoughts? Feel free to leave a comment on the DPO thread if you have any notes or additions.
Adamantish commentedon Oct 20, 2026
@sergey-miryanov That looks great. I wouldn't think I can say much about the finer implementation details