
We created a large-scale reference atlas of human B cell development by pooling scRNA-seq data from multiple pre-natal and post-natal tissue sources. Single-cell transcriptomes in this map spanned 90 donors across five tissues sources (fetal liver, fetal bone marrow, cord blood, pediatric bone marrow, adult bone marrow), and seven studies (Human Cell Atlas, Oetjen et al 2018, Ainciburu et al 2023, Setty et al 2019, Popescu et al 2019, Jardine et al 2021, Roy et al 2021).
Cell state annotations within this atlas were annotated based on reference transcriptomes from sorted cell populations along human B cell development together with expression of key surface markers across known stages of human B cell development.
We provide functions to rapidly and accurately map query scRNA-seq profiles of either normal or leukemic hematopoietic cells onto our atlas of B cell development. Mapping, QC Filtering, CellType prediction, Pseudotime prediction, and Composition analysis can be performed from raw count matrices within minutes (~20min total for ~10,000 cells on a personal laptop). Note that query cells are first mapped onto BoneMarrowMap to identify cells along the B-lymphoid lineage and subsequently mapped onto this focused B cell development atlas.
This code relies on the BoneMarrowMap R package (https://github.com/andygxzeng/BoneMarrowMap), please see the corresponding BoneMarrowMap github page for installation instructions (< 5 min) and a tutorial for running the tool. This was tested for compatibility on Linux, Mac, or Windows OS.
To cite this dataset or learn more, please refer to the bioRxiv pre-print: https://www.biorxiv.org/content/10.1101/2023.12.04.569954
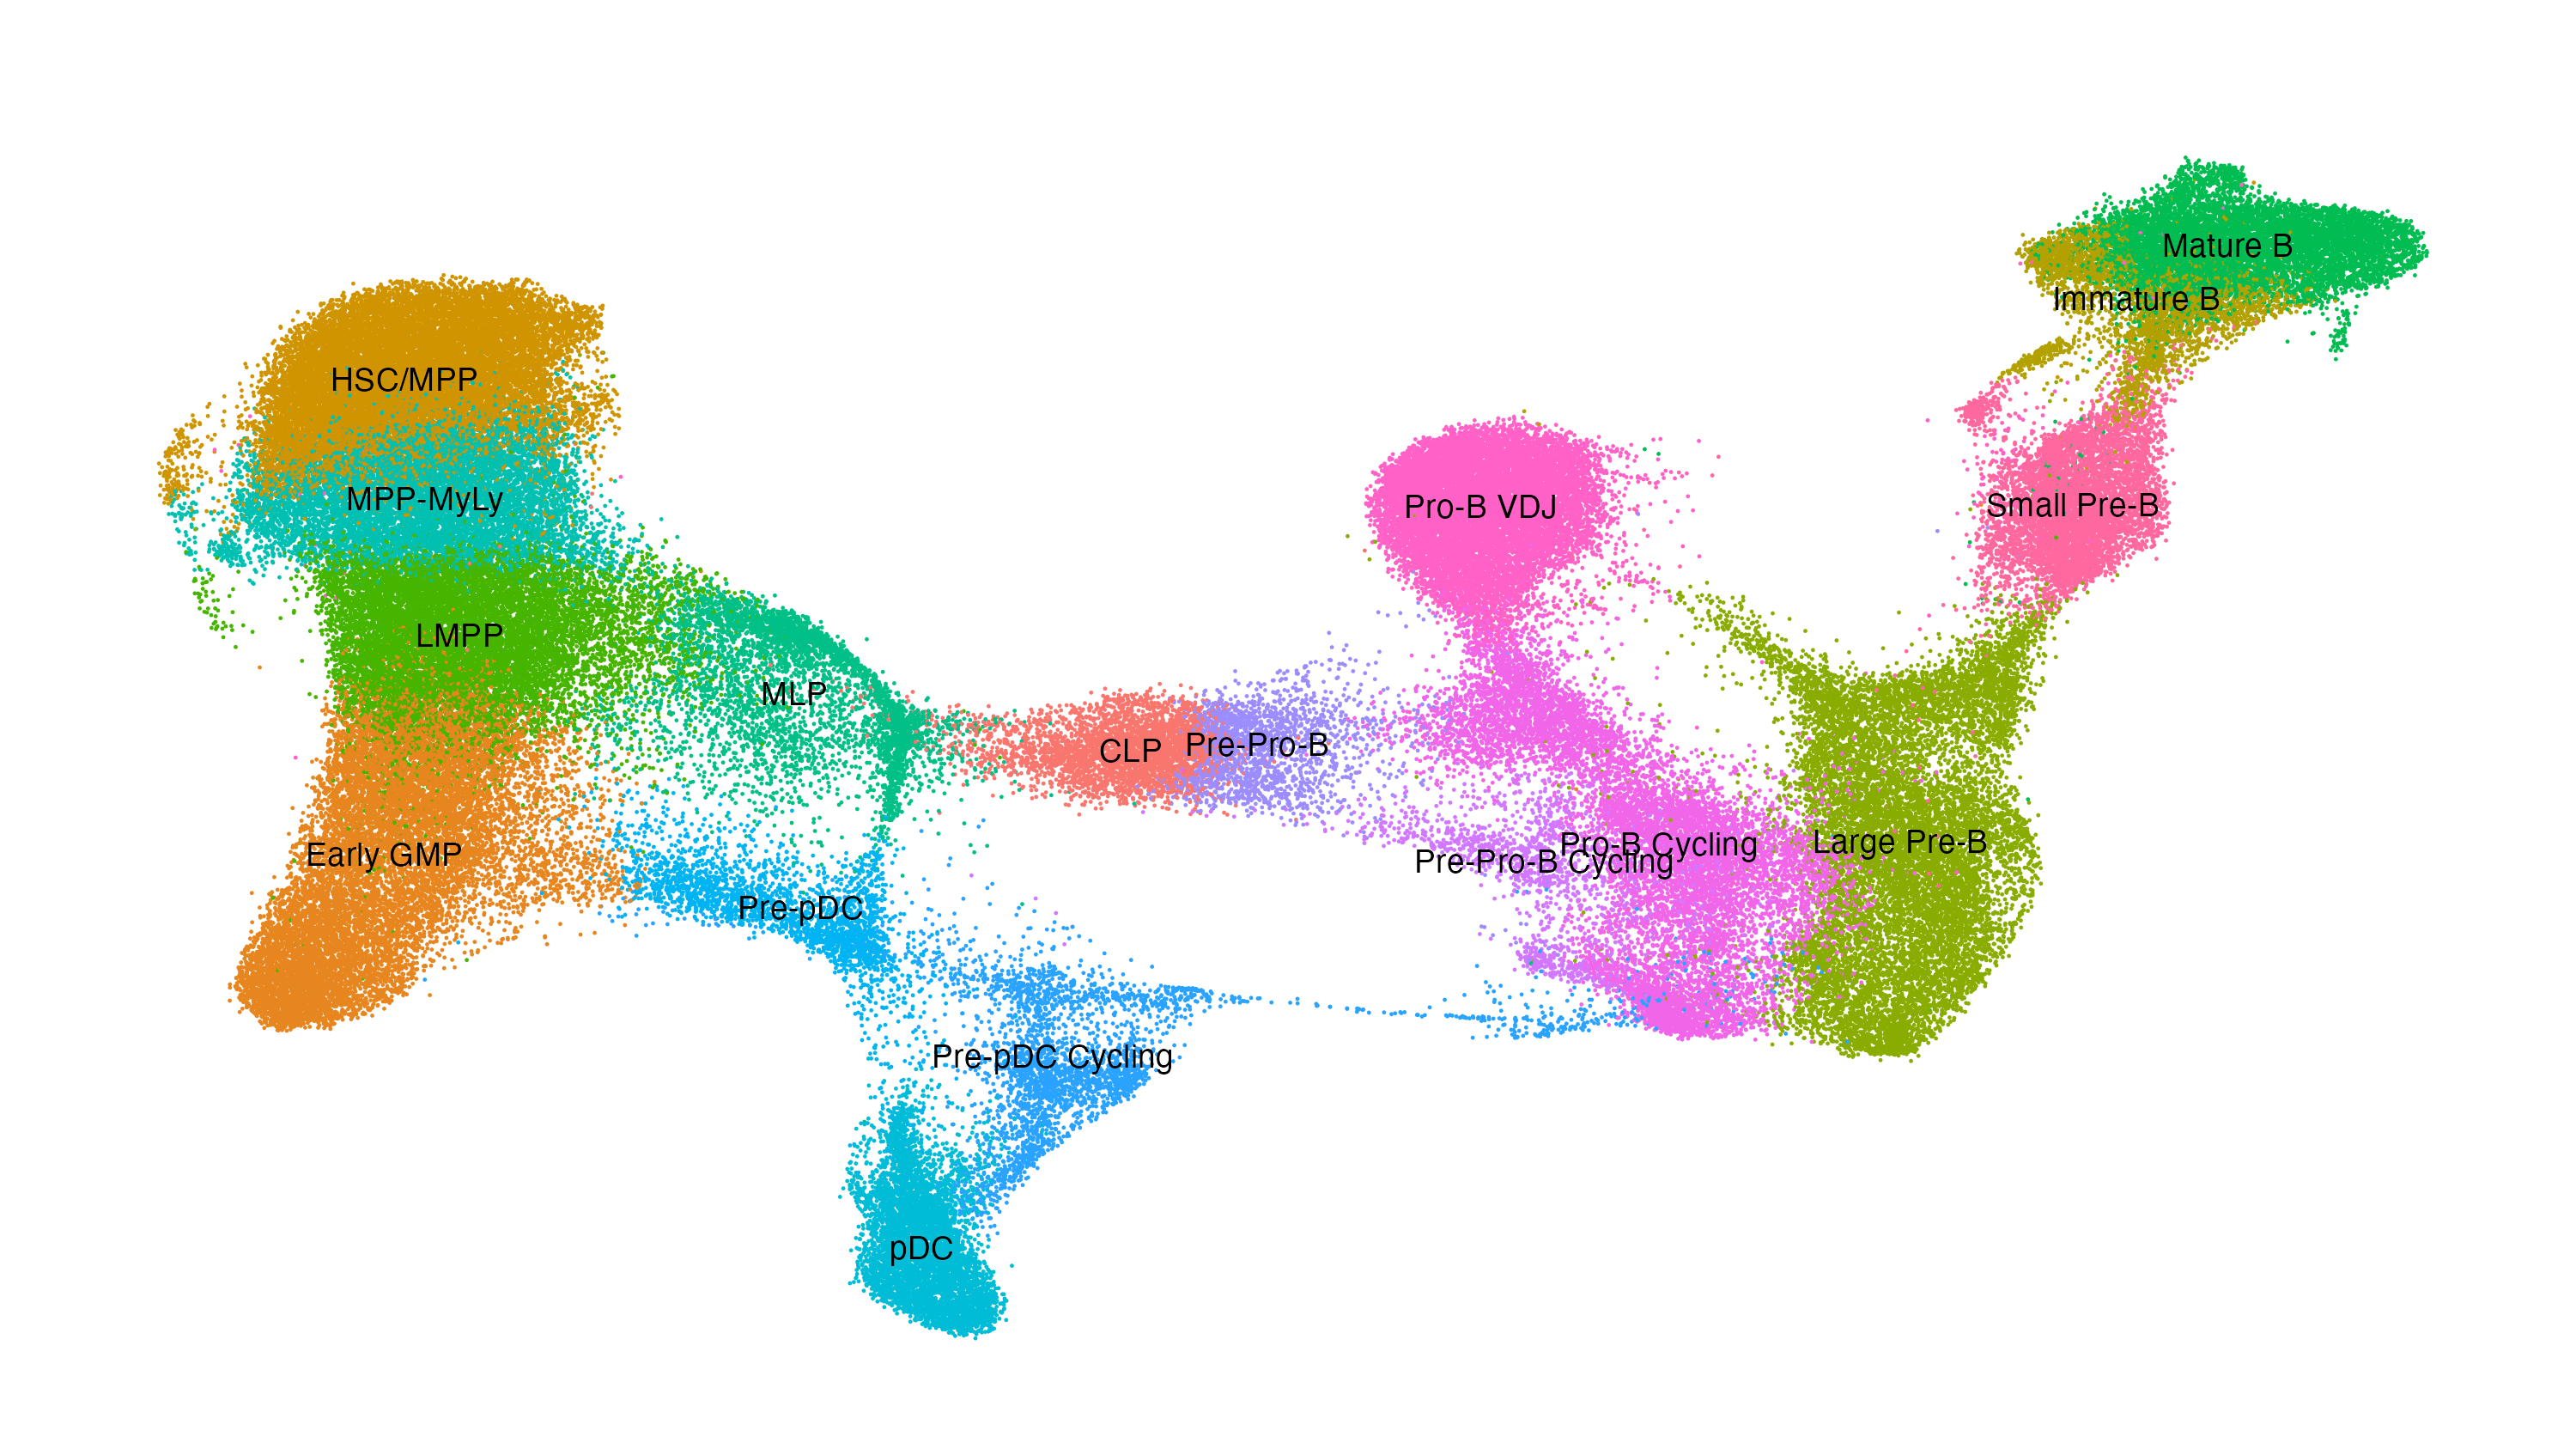
We provide analysis notebook for downloading the reference object and example B-ALL data from our study for performing reference mapping and celltype classification onto the cross-ontogeny B cell development atlas.
You can substitute the example dataset for your own scRNA-seq data. All you need is a raw or ambient RNA-corrected count matrix and cell annotations, ideally within a seurat object. Your data should be pre-filtered by n_counts, n_features, and percent_mito before mapping.
To run the example notebook within R markdown, you can download the Rmd file directly from your R console and get started on the analysis:
# Download R Notebook with mapping tutorial
download.file('https://raw.githubusercontent.com/andygxzeng/b_development_map/main/BALL_Projection_Example.Rmd',
              destfile = 'BALL_Projection_Example.Rmd')