Skewmap plotting is a bit off (reported by @nluchett). See attached image for output:
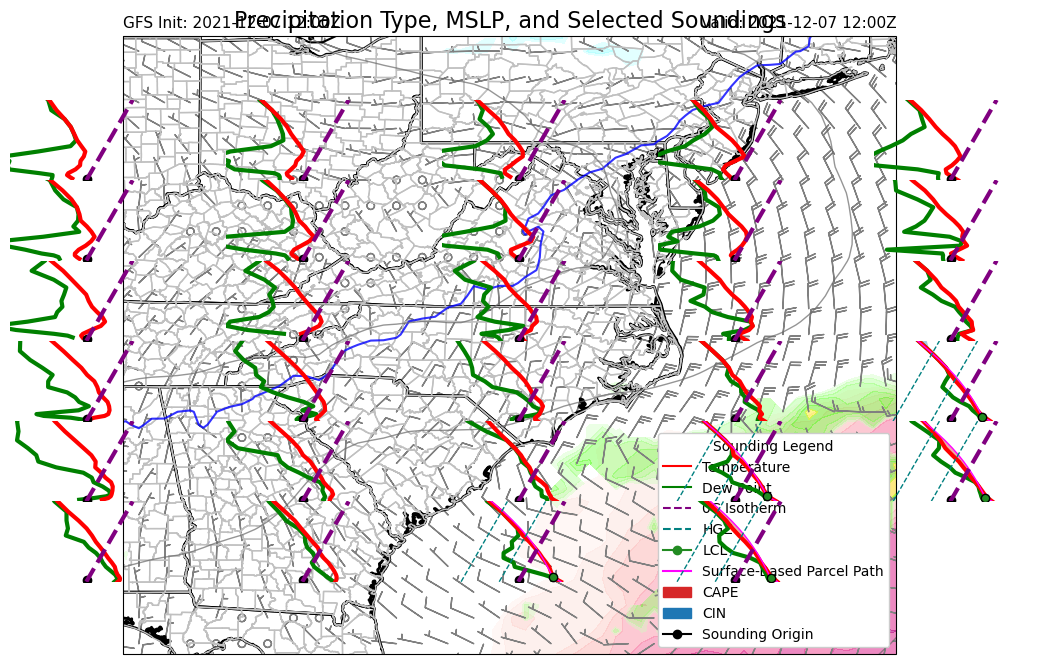
How did you get such a clean plot in the comment you posted earlier? It seems that my output does not include sounding data from above a certain latitude, while your plot does (in PA for example). I ran it with the same user inputs as you mention above:
domainsize='regional'
domainname='raleigh'
centerlat = 35.8
centerlon = 78.8
model = 'GFS'
cape_input = 'no'
wetbulb_input = 'yes'
season = 'winter'
Originally posted by @nluchett in #6 (comment)
Skewmap plotting is a bit off (reported by @nluchett). See attached image for output:
How did you get such a clean plot in the comment you posted earlier? It seems that my output does not include sounding data from above a certain latitude, while your plot does (in PA for example). I ran it with the same user inputs as you mention above:
domainsize='regional'
domainname='raleigh'
centerlat = 35.8
centerlon = 78.8
model = 'GFS'
cape_input = 'no'
wetbulb_input = 'yes'
season = 'winter'
Originally posted by @nluchett in #6 (comment)