

I build governed analytics systems that connect source data, business logic, semantic models, validation, and decision support — not just dashboards.




LinkedIn · Newest: Warehouse & Inventory BI · Healthcare Interoperability Platform · All Repositories
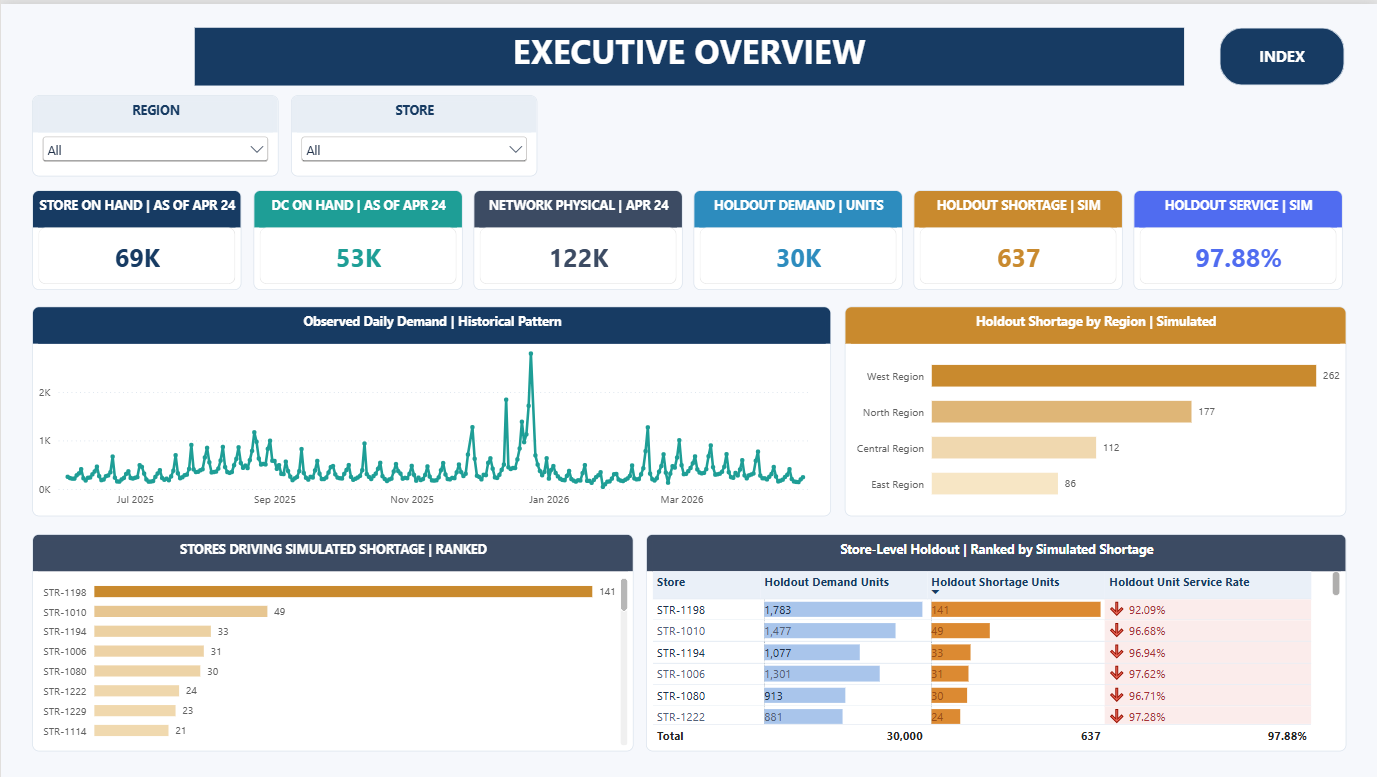
Open retail data → governed inventory analytics → Python & SQLite → dimensional modeling → a complete eight-page Power BI report.
Explore the full project → · View all 8 dashboard pages · Read the case study · Explore the engineering
| Power BI & semantic modeling | Analytical scope | Engineering and delivery |
|---|---|---|
| 8 pages · 112 visuals | 40 stores · 2,326 products | Python + executable SQLite |
| 51 DAX measures · 18 relationships | 5 dimensions · 4 facts | Reproducible sample + GitHub Actions |
The project retains the original historical Power BI report, its source-controlled PBIP / PBIR / TMDL, all eight real screenshots, licensed public retail RAW datasets, historical analytical tables, and a separately executable Python/SQLite simulation and validation pipeline.
Evidence-based modeling: it distinguishes observed sales and returns (OBS) from simulated inventory, service and supplier flows (SIM) and exploratory stock signals (EXP). The reconstructed simulation is not identical to the historical scenario; Power BI Desktop refresh remains to be verified independently.
Browse the evidence map · See CI checks · Open the native Power BI project
I work at the intersection of healthcare domain knowledge, retail and supply-chain operations, business intelligence, data analytics, and analytics engineering.
My projects typically follow this pattern:
Source → Data Quality → Canonical Model → SQL / Python → Semantic Model → Governed KPIs → BI Delivery → Independent Validation → Decision Support
The goal is not to make a chart look impressive. The goal is to make the number behind the chart defensible.
That means I consistently focus on:
- explicit analytical grain before aggregation;
- governed KPI definitions and ratio-of-totals logic;
- missing / suppressed / unavailable values that remain semantically distinct from zero;
- independent reconciliation across SQL, Python, DAX, Excel, or source artifacts;
- preservation of source anomalies instead of silently “cleaning” them away;
- lineage, reproducibility, tests, and CI as part of analytics delivery;
- clear boundaries between descriptive evidence and unsupported causal claims.
These are not generic demo claims — they come from implemented, documented projects in this GitHub account.
| Project | Selected validated engineering evidence |
|---|---|
| Enterprise Retail Warehouse & Inventory Intelligence | 8 native Power BI pages · 112 visuals · 51 DAX measures · 18 semantic relationships · 40 stores / 2,326 products · licensed public RAW + Python/SQLite + tested sample CI · case study |
| Healthcare Interoperability & Claims Intelligence | CMS Blue Button/FHIR pipeline · OAuth 2.0 + PKCE · PostgreSQL · 94 regression tests · 22 business tables · 50 relationships · 7-page PBIR report |
| Healthcare Data Governance & Quality Control Center | 2,801,660 published profiles · 70,052,393 represented line items · 19 governed DQ rules · SQL/Python/DAX reconciliation · 7-page Power BI delivery |
| CMS Transparency in Coverage PUF Analytics | 4,956 plans · 348 issuers · 30 states · 43 DAX measures · 11 PBIR pages · 63 DAX reconciliation checks / 0 failures |
| Hospital360 | 5,000 synthetic patients · 5,515,928 healthcare RAW rows · 36-month enterprise extension · PostgreSQL RAW→STAGING→ANALYTICS · 13-page Power BI report |
| Online Retail Growth & Customer Intelligence | 1,044,848 canonical transaction rows · RFM + cohorts + retention · 50 DAX measures · 10 Power BI pages · SQL-driven Excel management outputs |
| Regional Sales Performance Analytics | 18-page analytical engine · LFL / AST / recovery / lifecycle analysis · XLSX export · reproducible offline frontend · Tauri/Rust desktop packaging architecture |
My most complete interoperability and claims-engineering project.
CMS Blue Button sandbox → OAuth 2.0 + PKCE → FHIR Patient/Coverage/EOB → governed RAW → canonical claims grains → PostgreSQL analytics → TMDL semantic model → PBIR report → CI validation
Why it matters: healthcare claims data contains multiple nested grains. The project preserves claim, item, diagnosis, procedure, care-team, supporting-information, terminology, and financial meaning rather than flattening everything into one misleading table.
A governance-first implementation built on public CMS Medicare data.
RAW → STAGING → ANALYTICS + GOVERNANCE → DQ rules → lineage → governed KPI contracts → SQL/Python reconciliation → source-controlled Power BI
Highlights include source fingerprinting, field-level lineage, preserved source conflicts, weighted utilization/payment metrics, and explicit publication boundaries.
A payer-transparency analytics implementation where availability is modeled as data, not guessed from blanks.
The project separates issuer and plan grains, preserves source anomalies, uses ratio-of-totals KPI semantics, and reconciles the saved Power BI model against independent Python baselines.
Official Saudi Ministry of Health yearbooks transformed into a governed canonical model across capacity, activity, workforce, and regional healthcare resources.
Python discovery → canonical CSVs → SQL Server star schema → DAX semantic model → 7-page PBIR report → layered validation
A production-style synthetic hospital analytics platform combining:
clinical activity · claims · finance · budget · workforce · operations · capacity · technology
The project uses PostgreSQL, dimensional modeling, explicit fact grains, SQL regression, Python analytics, Power BI, and scale testing up to a 20K synthetic source generation benchmark.
End-to-end customer and growth analytics built from the public UCI Online Retail II dataset.
Transaction governance → SQL Server star schema → repeat behavior → RFM → acquisition cohorts → retention → cancellations → Power BI → SQL-driven Excel management outputs
| Domain | Project | Core focus |
|---|---|---|
| Warehouse & Distribution | Enterprise Retail Warehouse & Inventory Intelligence | Store/DC stock intelligence · observed demand/returns · simulated service and supplier execution · 8-page Power BI PBIP |
| Reconciliation | Transaction Reconciliation & Exception Intelligence | Explainable 8-level matching · discrepancy exposure · anomaly rules · prioritized review queues |
| Regional Performance | Regional Sales Performance Analytics | Budget gap · LFL · traffic · weighted AST · recovery scenarios · lifecycle · Tauri desktop architecture |
| Category Management | Pharmacy Category Management Analytics | Margin · assortment · inventory risk · supplier service · pricing · descriptive promotion analysis |
| Inventory | Pharmacy Inventory & Expiry Analytics | 90-day demand · stock cover · expiry · dead/slow stock · deterministic generation |
| Product / Assortment | Pharmacy Product Analytics | SKU status · TGM · zero-sales risk · top-N · supplier dependency |
| Prescription Operations | Prescription Operations Analytics | Multi-branch workflow analytics · completion · backlog · shortages · publication safety |
| E-commerce | Pharmacy E-commerce Category Analytics | Digital category performance · commercial KPIs · decision support |
| Branch Performance | Branch Performance KPI Dashboard | Branch sales · customers · basket · employee/category performance |
I use a simple rule:
If a KPI cannot survive grain review, reconciliation, and evidence review, it is not ready for a dashboard.
Every fact table starts with an explicit business grain and key contract.
Duplicates, orphan keys, missing mappings, availability states, impossible values, and source conflicts stay visible.
SQL, Python, DAX, Excel, and UI outputs should reconcile to the same governed business meaning.
Claims are not flattened into claim items. Finance is not joined directly to operations. Issuer metrics are not duplicated across plan rows.
Unknown, unavailable, suppressed, mapping-pending, zero, and not-applicable are different analytical states.
Screenshots, dashboards, or presentation graphics never override the source, model, tests, or reconciliation evidence.
Where possible, repositories include regression tests, reproducibility checks, source/generated parity, privacy controls, and GitHub Actions quality gates.
|
Power BI |
SQL Server |
FHIR |
Git / GitHub |
My background combines pharmacy / healthcare domain knowledge with business and analytics training.
That helps me work on problems where technical correctness alone is not enough — the analyst also needs to understand the operational meaning of claims, utilization, warehouse and distribution-center inventory, replenishment, commercial performance, supplier service, customer behavior, and management KPIs.
Pharmacy background · MBA · Data Analyst Associate · Healthcare / BI / Analytics Engineering focus
I am focused on full-time opportunities in:
Data Analytics · Business Intelligence · Healthcare Analytics · Retail / Supply Chain / Inventory Analytics · BI / Reporting · Commercial & Performance Analytics · Revenue Cycle / Claims Analytics · Analytics Engineering
Especially roles where Power BI + SQL + Python + domain knowledge + data quality + decision support are used together.