
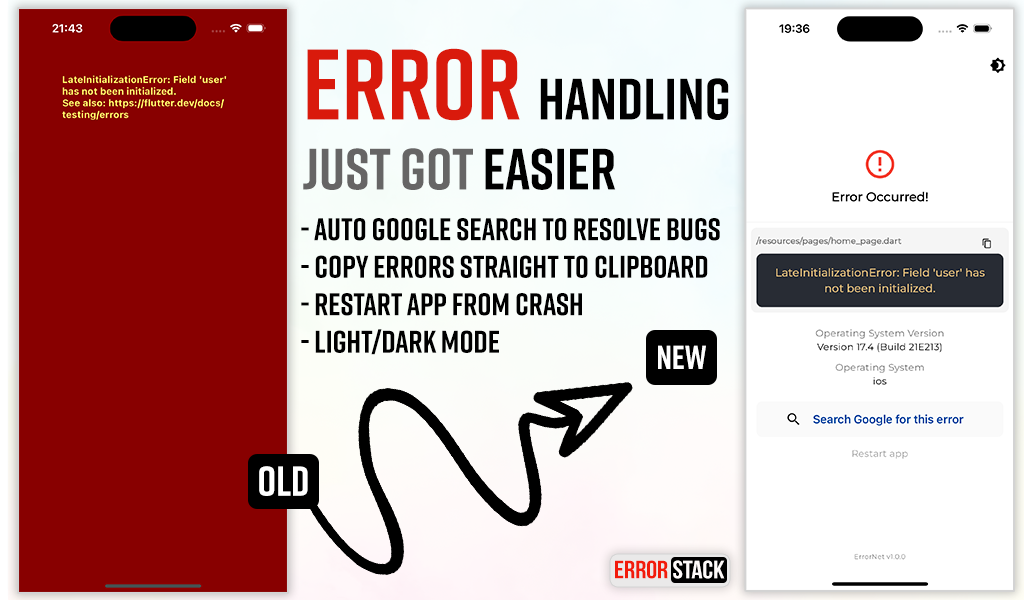
Error Stack is a comprehensive error handling and debugging toolkit for Flutter. It provides beautiful error screens in debug mode with actionable information, customizable error pages for production, and a powerful dev panel for runtime debugging.
- Beautiful debug error screens with Google search links and stack traces
- Customizable production error pages
- Light and dark mode support
- Dev Panel - Runtime debugging tool with:
- API request/response logging
- Console logging with severity levels
- Navigation route tracking
- Local storage viewer (Secure Storage & Shared Preferences)
- UI debugging overlays (grid, layout bounds, etc.)
- Dio interceptor for automatic HTTP logging
- SOLID architecture with dependency injection support
Add the following to your pubspec.yaml:
dependencies:
  error_stack: ^2.1.1
Or install via command line:
dart pub add error_stackimport 'package:flutter/material.dart';
import 'package:error_stack/error_stack.dart';
void main() async {
WidgetsFlutterBinding.ensureInitialized();
await ErrorStack.init();
runApp(MyApp());
}
class MyApp extends StatelessWidget {
@override
Widget build(BuildContext context) {
return MaterialApp(
builder: ErrorStack.builder, // Adds dev panel and UI debug overlays
home: HomePage(),
);
}
}import 'package:error_stack/error_stack.dart';
class AppProvider {
@override
boot(Nylo nylo) async {
nylo.useErrorStack();
}
}await ErrorStack.init(
level: ErrorStackLogLevel.verbose, // verbose | minimal
initialRoute: '/', // Route for "Restart app" button
forceDebugWidget: false, // Show debug widget in release mode
enableDevPanel: true, // Enable/disable dev panel (default: debug mode only)
devPanelConfig: DevPanelConfig(
enableApiLogging: true,
enableConsoleLogging: true,
enableRouteTracking: true,
apiLogLimit: 100,
consoleLogLimit: 100,
routeHistoryLimit: 50,
),
errorWidget: (errorDetails) { // Custom release mode error widget
return Scaffold(
body: Center(
child: Text('Something went wrong'),
),
);
},
);ErrorStackLogLevel.verbose(default) - Full stack trace and detailsErrorStackLogLevel.minimal- Basic error information only
The Dev Panel is a runtime debugging tool accessible in debug mode. It provides 4 main tabs plus UI debugging tools.
import 'package:error_stack/error_stack.dart';

void main() async {
  WidgetsFlutterBinding.ensureInitialized();
  await ErrorStack.init();
  runApp(MyApp());
}

class MyApp extends StatelessWidget {
  @override
  Widget build(BuildContext context) {
    return MaterialApp(
      navigatorObservers: [ErrorStackNavigatorObserver()], // Route tracking
      builder: ErrorStack.builder, // Dev panel bar and UI overlays
      home: HomePage(),
    );
  }
}Option 1: Long-press the "Dev Mode" bar at the bottom of the screen
Option 2: Call programmatically:
ErrorStack.showDevPanel(context);View HTTP requests and responses with timing, headers, and body data.
import 'package:error_stack/error_stack_dio.dart';

final dio = Dio();
dio.interceptors.add(ErrorStackDioInterceptor());

// All requests are automatically logged
final response = await dio.get('https://api.example.com/users');// Log a complete request
DevPanelStore.instance.logApi(
method: 'GET',
url: 'https://api.example.com/users',
statusCode: 200,
durationMs: 150,
requestHeaders: {'Authorization': 'Bearer token'},
responseBody: {'users': []},
);
// Or track pending requests
final requestId = DevPanelStore.instance.startApiRequest(
method: 'POST',
url: 'https://api.example.com/data',
requestBody: {'key': 'value'},
);
// Later, complete the request
DevPanelStore.instance.completeApiRequest(
requestId: requestId,
statusCode: 201,
durationMs: 250,
responseBody: {'success': true},
);Console logs with filtering by severity level. Tap the copy icon on any log entry to copy the full entry (level, timestamp, tag, message, and stack trace) to the clipboard.
import 'package:error_stack/error_stack.dart';

// Log at different levels
DevPanelStore.instance.debug('Debug message');
DevPanelStore.instance.info('User logged in', tag: 'auth');
DevPanelStore.instance.warning('Cache miss for key');
DevPanelStore.instance.error('Failed to load data', stackTrace: trace.toString());

// With metadata
DevPanelStore.instance.info(
  'Payment processed',
  tag: 'payments',
  metadata: {'amount': 99.99, 'currency': 'USD'},
);Navigation history with route names, arguments, and actions. Tap a route to open its details sheet, where you can copy the route name to the clipboard.
Route tracking is automatic when using ErrorStackNavigatorObserver:
MaterialApp(
  navigatorObservers: [ErrorStackNavigatorObserver()],
  // ...
)
Manual tracking is also available:
DevPanelStore.instance.trackRoutePush('/profile', arguments: {'userId': 123});
DevPanelStore.instance.trackRoutePop('/profile');
DevPanelStore.instance.trackRouteReplace('/home');View all local storage data from both Secure Storage and Shared Preferences. Tap an entry to open the edit modal, where you can copy the key or value to the clipboard or update the stored value.
The dev panel includes visual debugging overlays:
| Tool | Description |
|---|---|
| Grid Paper | Overlay grid for alignment checking |
| Layout Bounds | Show widget boundaries |
| Text Scale | Override text scale (0.5-3.0x) |
| Color Blindness | Simulate protanopia, deuteranopia, tritanopia |
| Slow Animations | 5x animation slowdown |
| Performance Overlay | Flutter performance metrics |
| Safe Areas | Visualize safe area boundaries |
Control programmatically:
final store = DevPanelStore.instance;

store.toggleGridPaper(true);
store.setGridSpacing(24.0);
store.toggleLayoutBounds(true);
store.setTextScaleFactor(1.5);
store.setColorBlindnessMode(ColorBlindnessMode.protanopia);
store.toggleSlowAnimations(true);
store.togglePerformanceOverlay(true);
store.toggleSafeAreas(true);

// Reset all to defaults
store.resetUIDebugSettings();Error Stack follows SOLID principles with a modular design:
lib/
├── error_stack.dart              # Main entry point & exports
├── error_stack_dio.dart          # Dio interceptor export
├── src/
│   ├── config/                   # Configuration classes
│   ├── storage/                  # Storage abstraction
│   ├── handler/                  # Error handling logic
│   └── dev_panel/                # Dev panel components
│       ├── data/                 # Store, models, collections
│       ├── widgets/              # Panel UI widgets
│       ├── interceptors/         # Dio interceptor
│       └── observers/            # Navigator observer
└── widgets/                      # Error display widgets
Check out the example app for comprehensive demos including:
- Basic setup
- Custom error widgets
- Dev panel features
- Dio integration
See CHANGELOG for release history.
The MIT License (MIT). See LICENSE for details.