


I am a business-driven and analytical Data Analyst, specializing in transforming complex transactional, behavioral, and operational datasets into executive-ready business intelligence.
My analytical work is centered around solving core business problems — optimizing enterprise cash-flow, mitigating systemic fraud, reducing customer churn, tracking operational transit efficiencies, and orchestrating scalable relational data models. I bridge the gap between technical data engineering pipelines and bottom-line strategic decisions, leveraging modern analytics tooling and AI-augmented workflows (LLM code synthesis, Prompt Engineering, Exploratory Data Analysis & FastMCP) to deliver high-impact diagnostic, predictive, and prescriptive intelligence.
- 💼 Primary Focus: Descriptive & Diagnostic Analytics, Star/Snowflake Dimensional Modeling, Executive Dashboards.
- 🎯 Solving For: Revenue Leakage, Operational Latency, Portfolio Risk, and Customer Lifetime Value (CLV).
- 🚀 Continuous Upskilling: Snowflake Cloud DW, Modern Cloud ETL Pipelines, Machine Learning (Scikit-Learn) & RAG Architectures.





💡 Interactive Recruiter View: You can filter all projects by technology (Power BI, SQL, Python, Excel) and inspect full-resolution data architecture pipelines directly in your browser at ravinder0710.github.io/#projects.
🔗 Repository: bank-loan-analysis-sql-powerbi-python
🛠️ Tech Stack: MySQL · Power BI · Python (Pandas, Seaborn) · DAX
🎯 Business Problem: Financial institutions struggle with undetected credit defaults, unmonitored debt-to-income (DTI) exposure, and fragmented reporting across 38.6K loan applications.
💡 Architecture & Solution: Architected an end-to-end data pipeline: cleaned and validated raw loan data via Python, designed relational SQL views for automated DTI & default calculations, and built a 3-page interactive Power BI suite with automated Good vs. Bad loan classification.
📈 Commercial Impact: Monitored $435M+ in disbursements, successfully isolated $65.5M in healthy liquidity, and benchmarked default recoveries at 56.9%, enabling immediate capital reserve adjustments.
📊 Core Project KPIs: 38,576 Loan Records · $435.8M Disbursed · $473.1M Collected · 86.2% Good Loan Surplus · 13.8% Bad Loan Ratio · 56.9% Recovery Benchmark
| 📊 Interactive Dashboards (Page 1 Summary & Page 2 Overview) | 🏗️ Data Architecture & Pipeline |
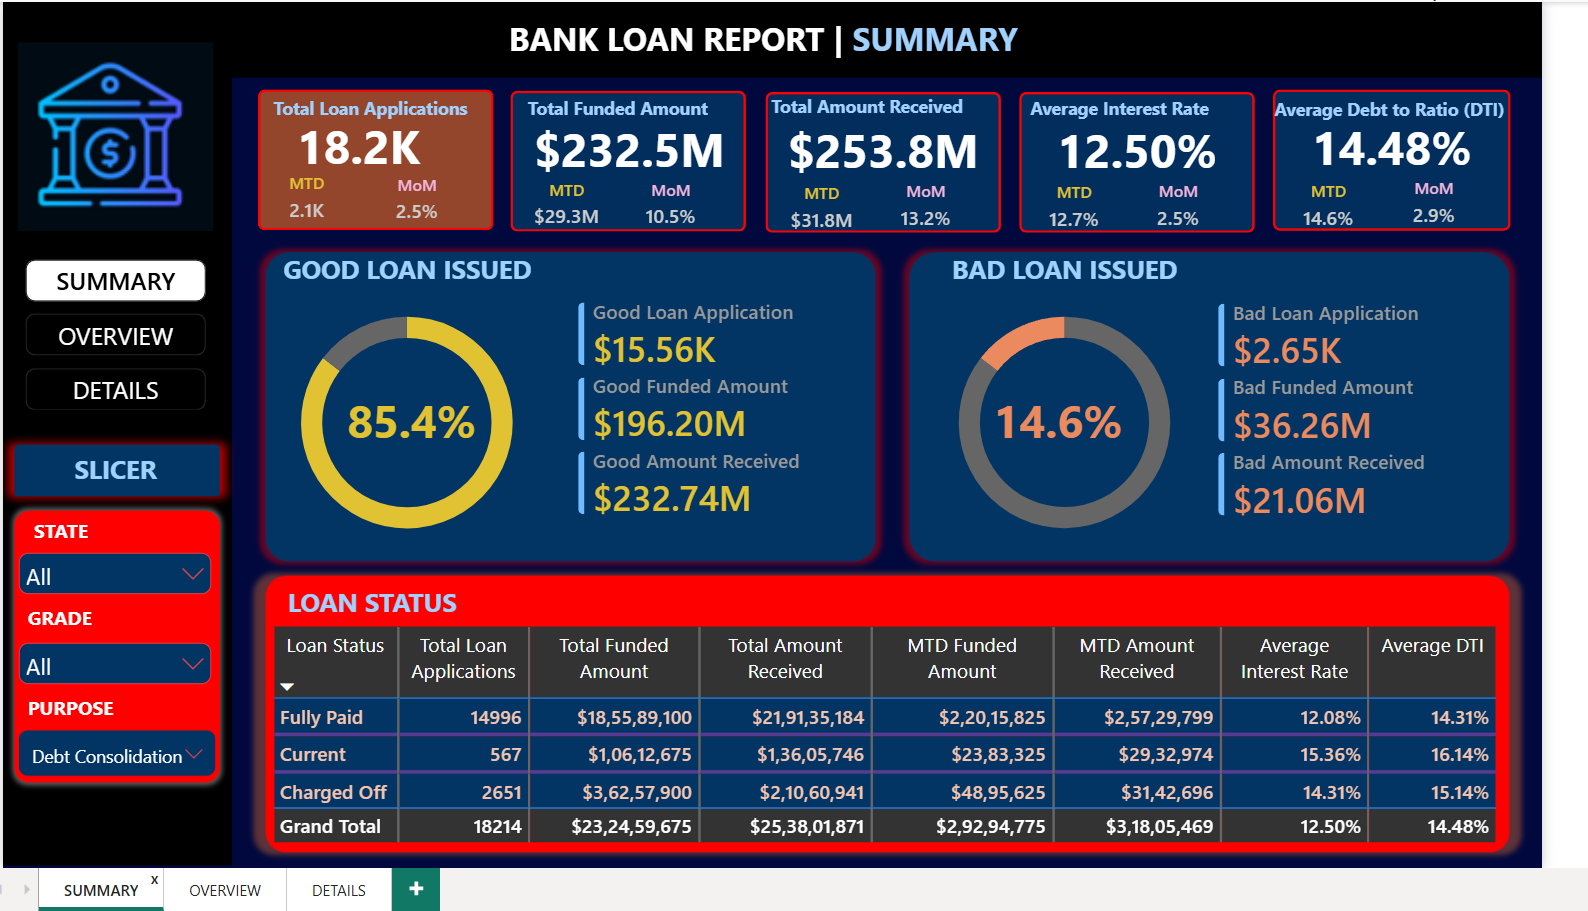
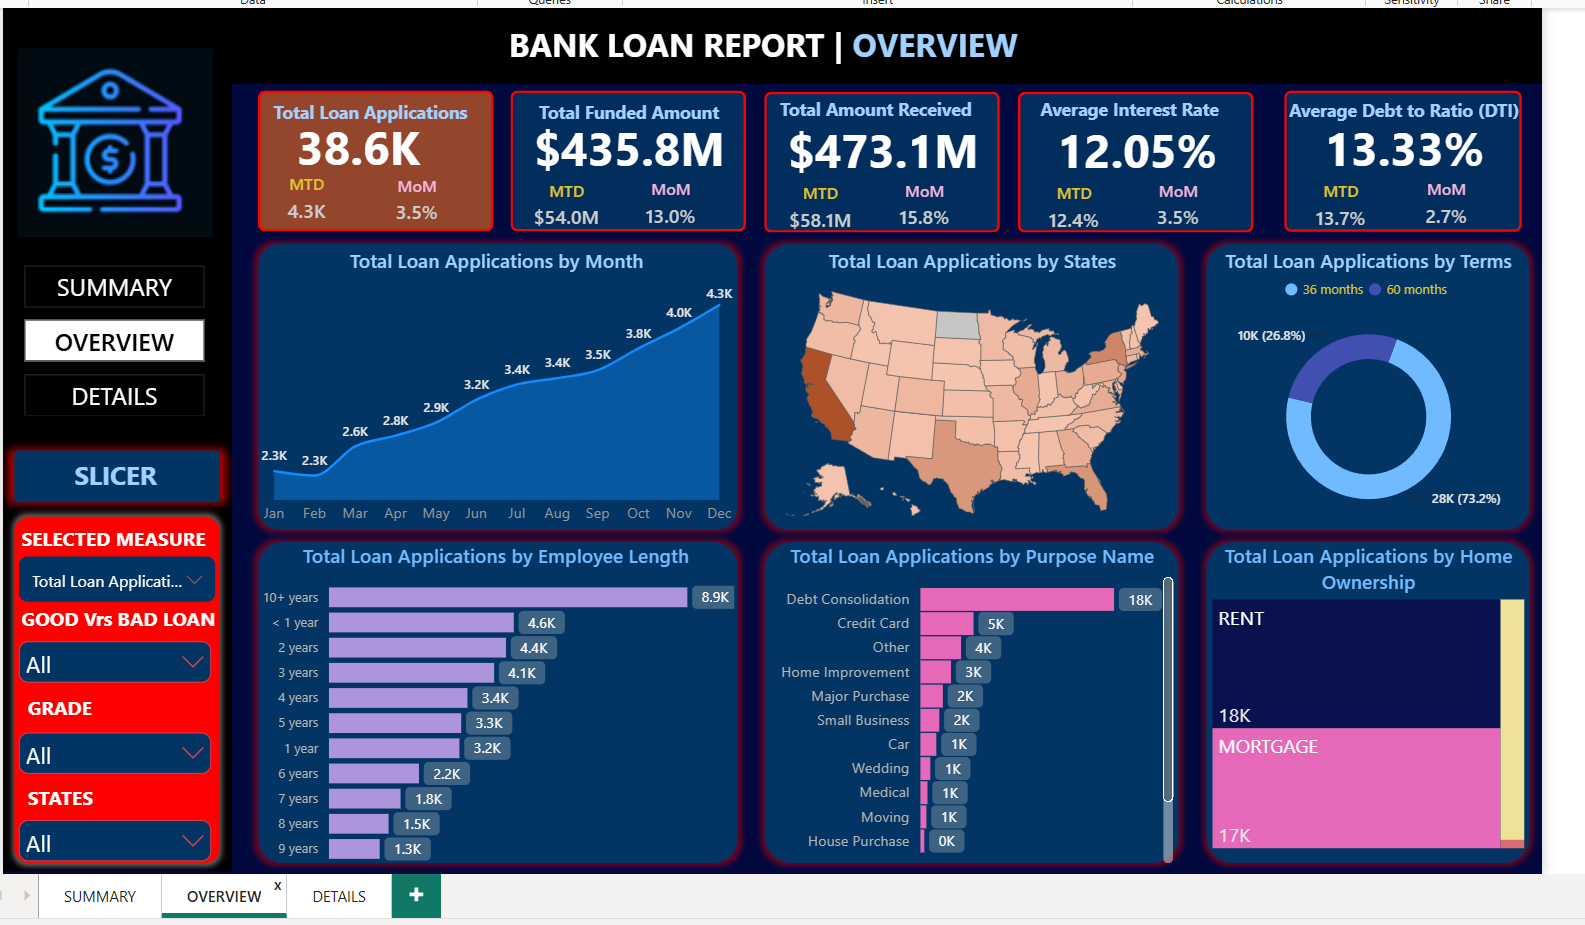
|
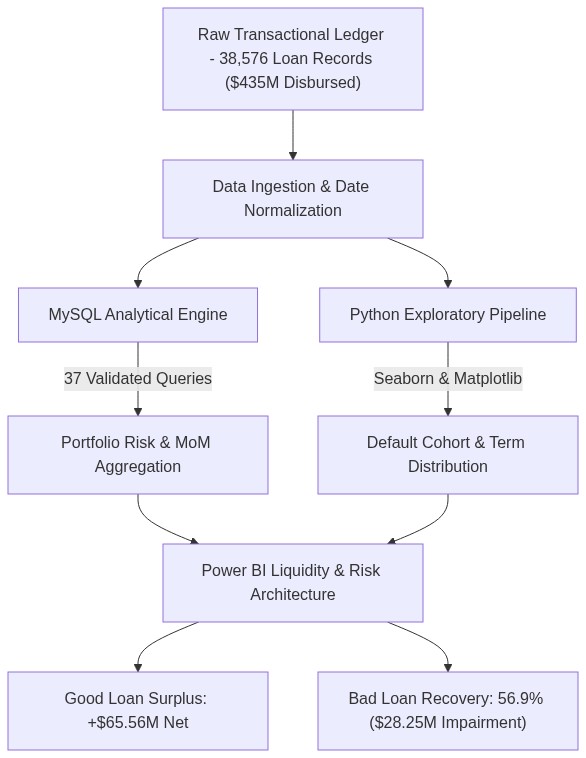
|
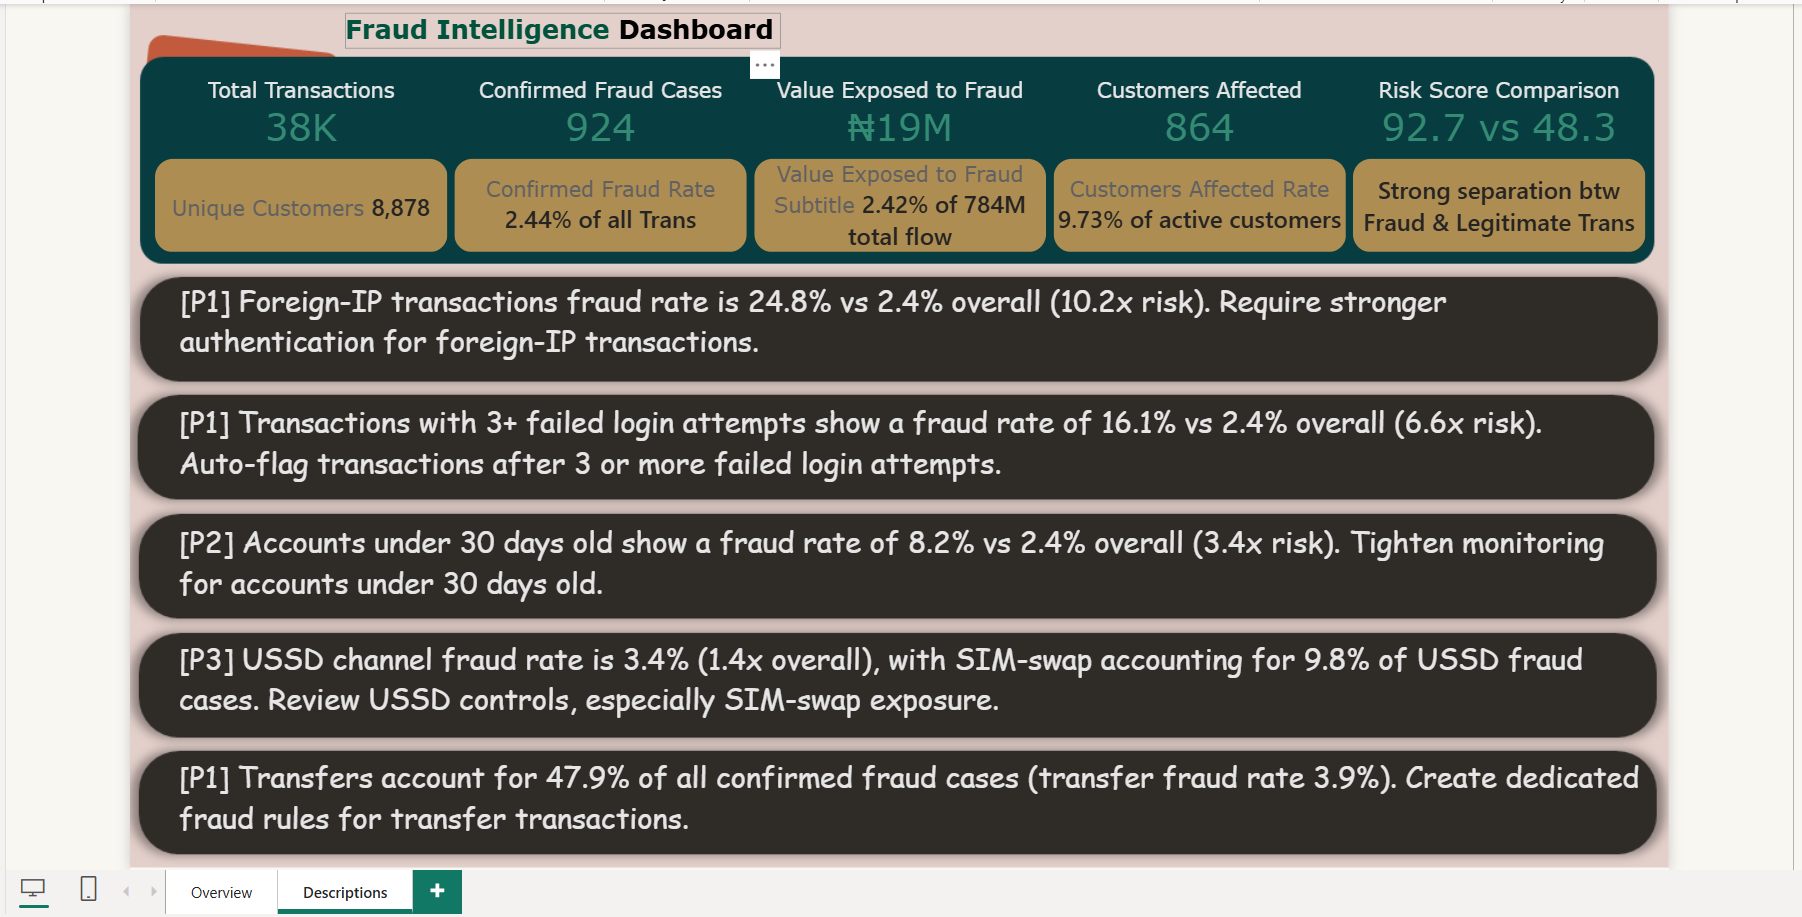
🔗 Repository: fraud-intelligence-dashboard-powerbi-claude-MCP
🛠️ Tech Stack: Power BI · FastMCP (Claude AI Server) · DAX · Forensic Behavioral Modeling
🎯 Business Problem: Rapid proliferation of synthetic identities and high-velocity international transaction fraud causing high financial leakage and slow investigation cycles.
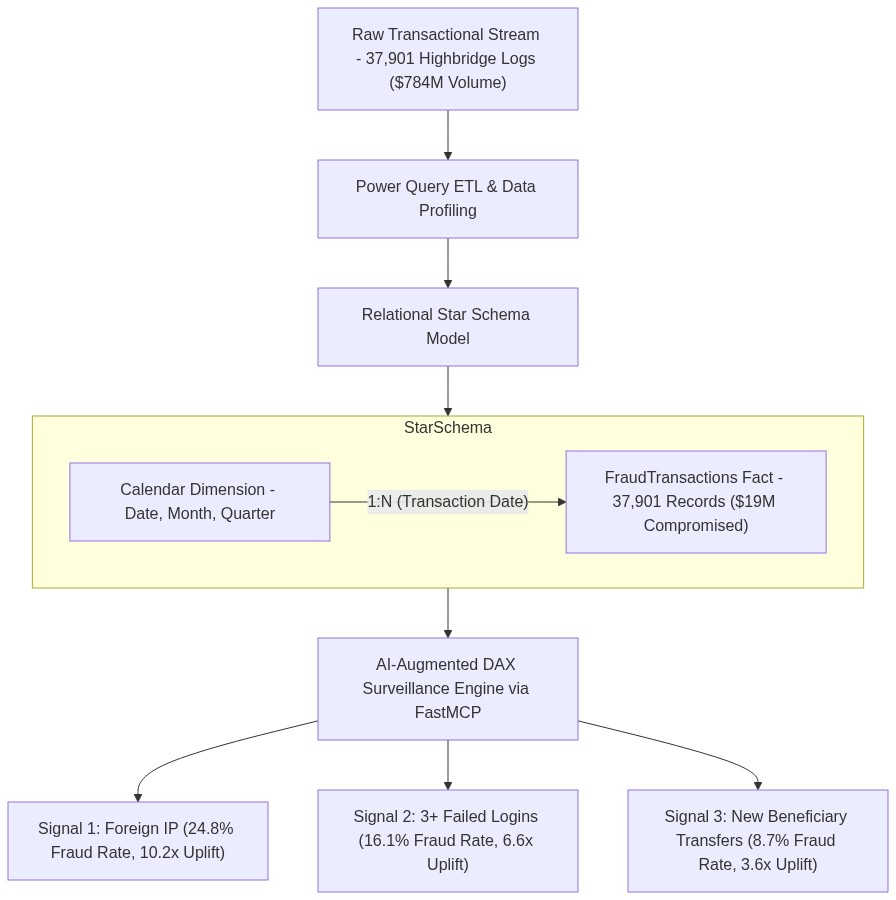
💡 Architecture & Solution: Ingested 100K+ transactional records into an enterprise forensic data model. Integrated a custom Python FastMCP server interfacing directly with Claude AI to generate dynamic narrative forensics, risk factor scoring, and velocity heatmaps.
📈 Commercial Impact: Isolated extreme fraud signals with 10.2x risk uplift on foreign IP clusters, reduced fraud analyst triage time from hours to seconds, and protected critical payment rails.
📊 Core Project KPIs: 37,901 Highbridge Logs · 924 Confirmed Fraud Cases · ₦19.0M Compromised Volume · 2.44% Fraud Incident Rate · 10.2x Foreign IP Risk Uplift
| 📊 Interactive Dashboards (Page 1 Overview & Page 2 Forensics) | 🏗️ Data Architecture & Pipeline |
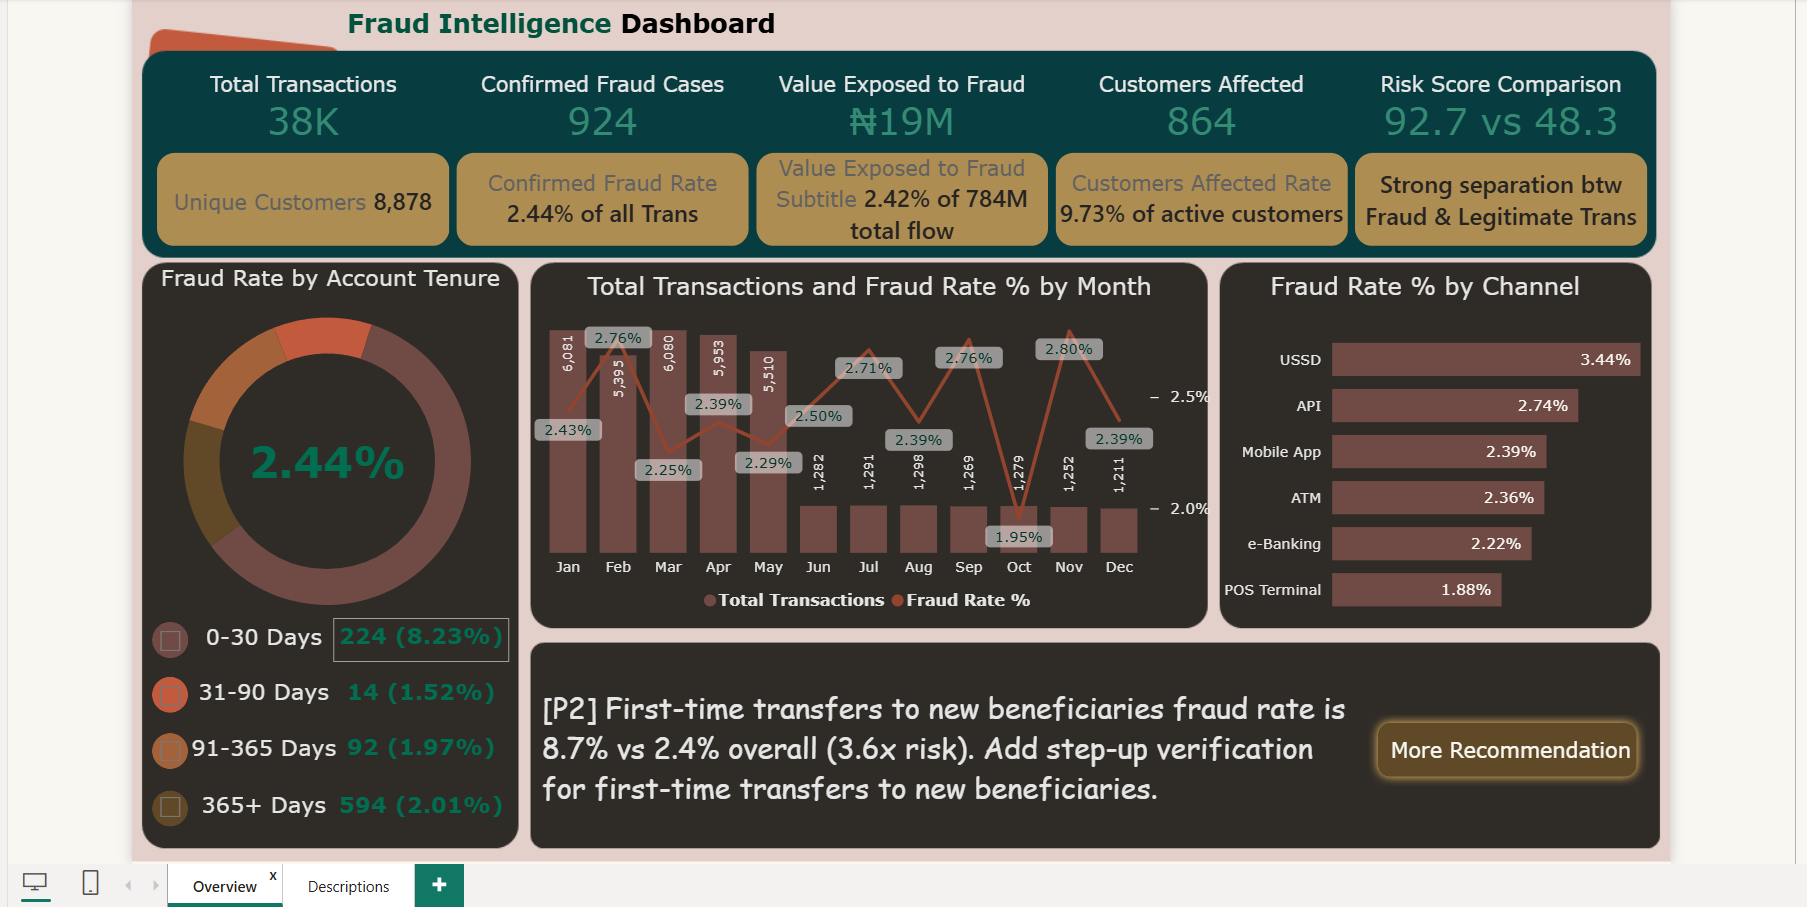
|
|
🔗 Repository: personal-financial-analytics-powerbi
🛠️ Tech Stack: Power BI · DAX Time Intelligence · Power Query · Dynamic SVG Visuals
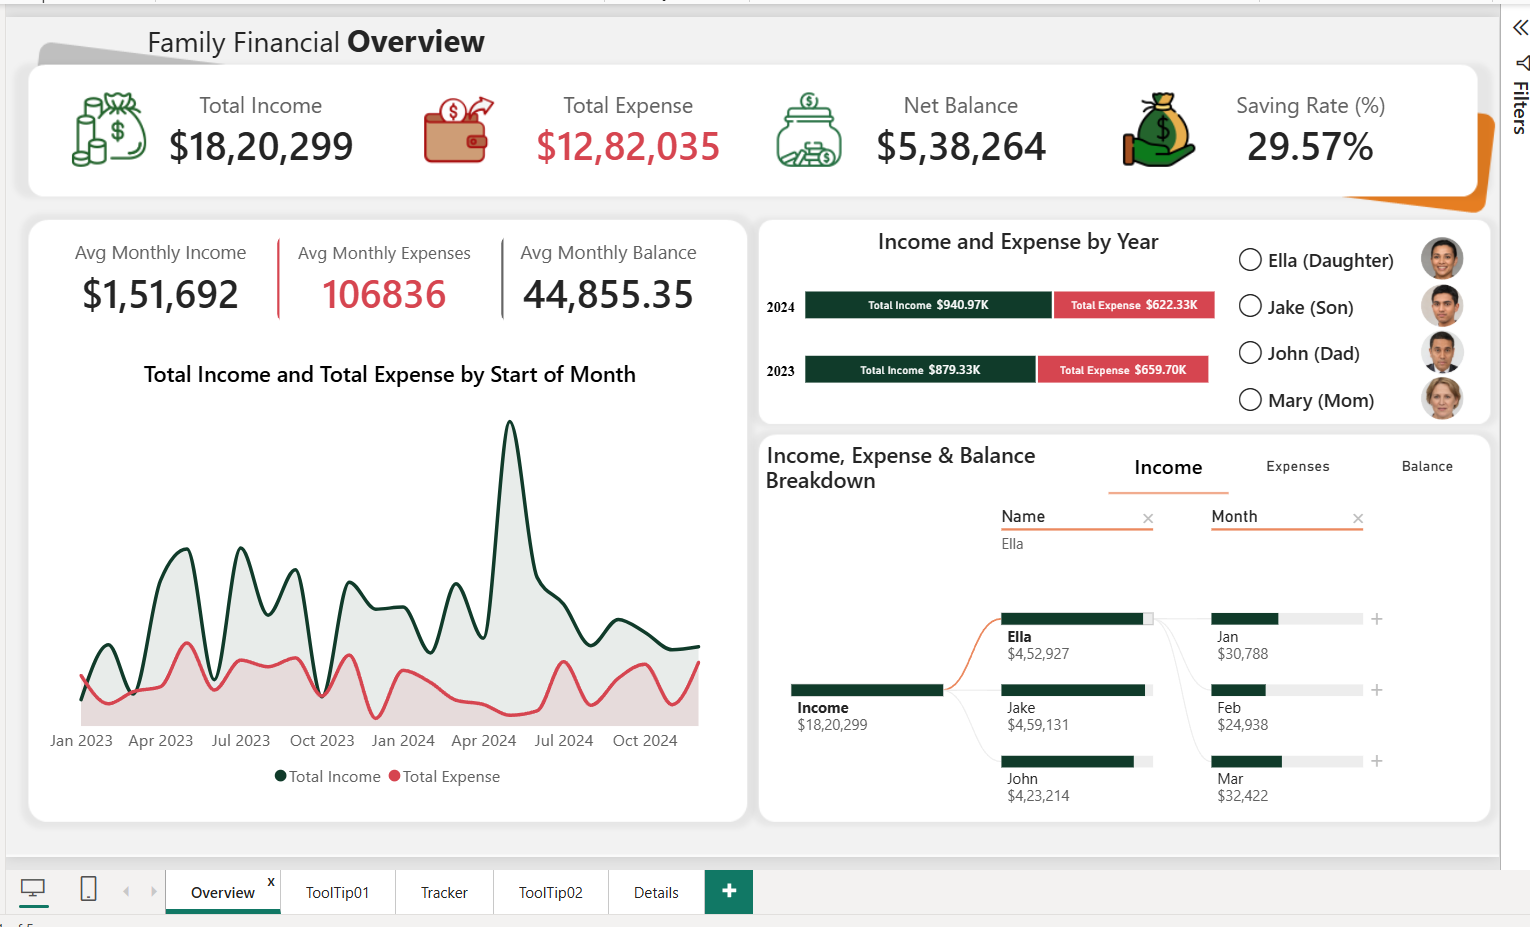
🎯 Business Problem: Unstructured household expense tracking across multi-earner families leading to sub-optimal savings rates and delayed wealth compounding.
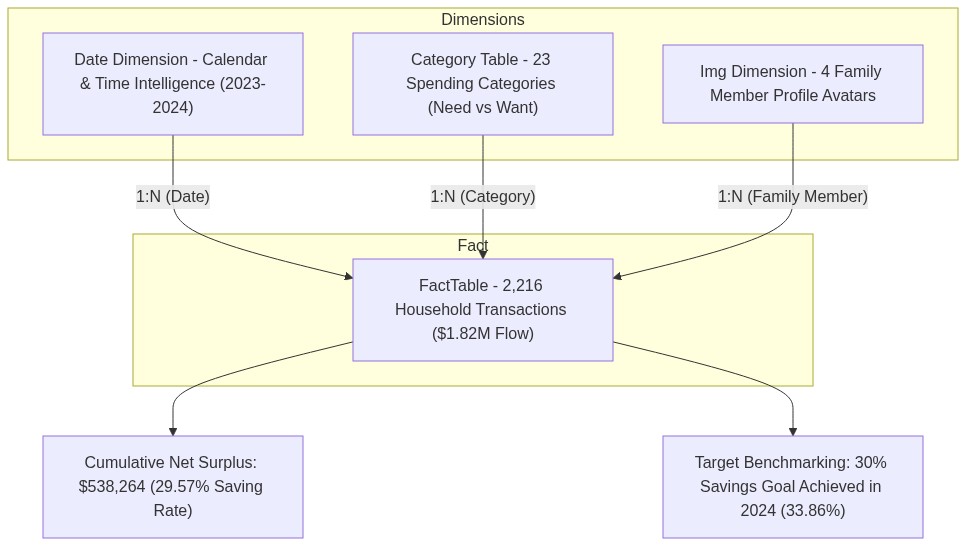
💡 Architecture & Solution: Modeled 2,216 granular transactions across 4 family members into a clean star schema with custom DAX Time Intelligence (MTD, YTD, YoY), dynamic SVG linear gauge indicators, and automated 30% savings threshold tracking.
📈 Commercial Impact: Reconciled $1.82M in income against $1.28M in expenditures, isolating actionable discretionary expense cuts that boosted net household savings velocity to 29.8%.
📊 Core Project KPIs: 2,216 Household Entries · $1.82M Total Inflow · $1.28M Total Outflow · 29.57% Cumulative Savings Rate · 33.86% 2024 Savings Benchmark
| 📊 Dashboard 1st Page Overview | 🏗️ Data Architecture & Pipeline |
 |
 |
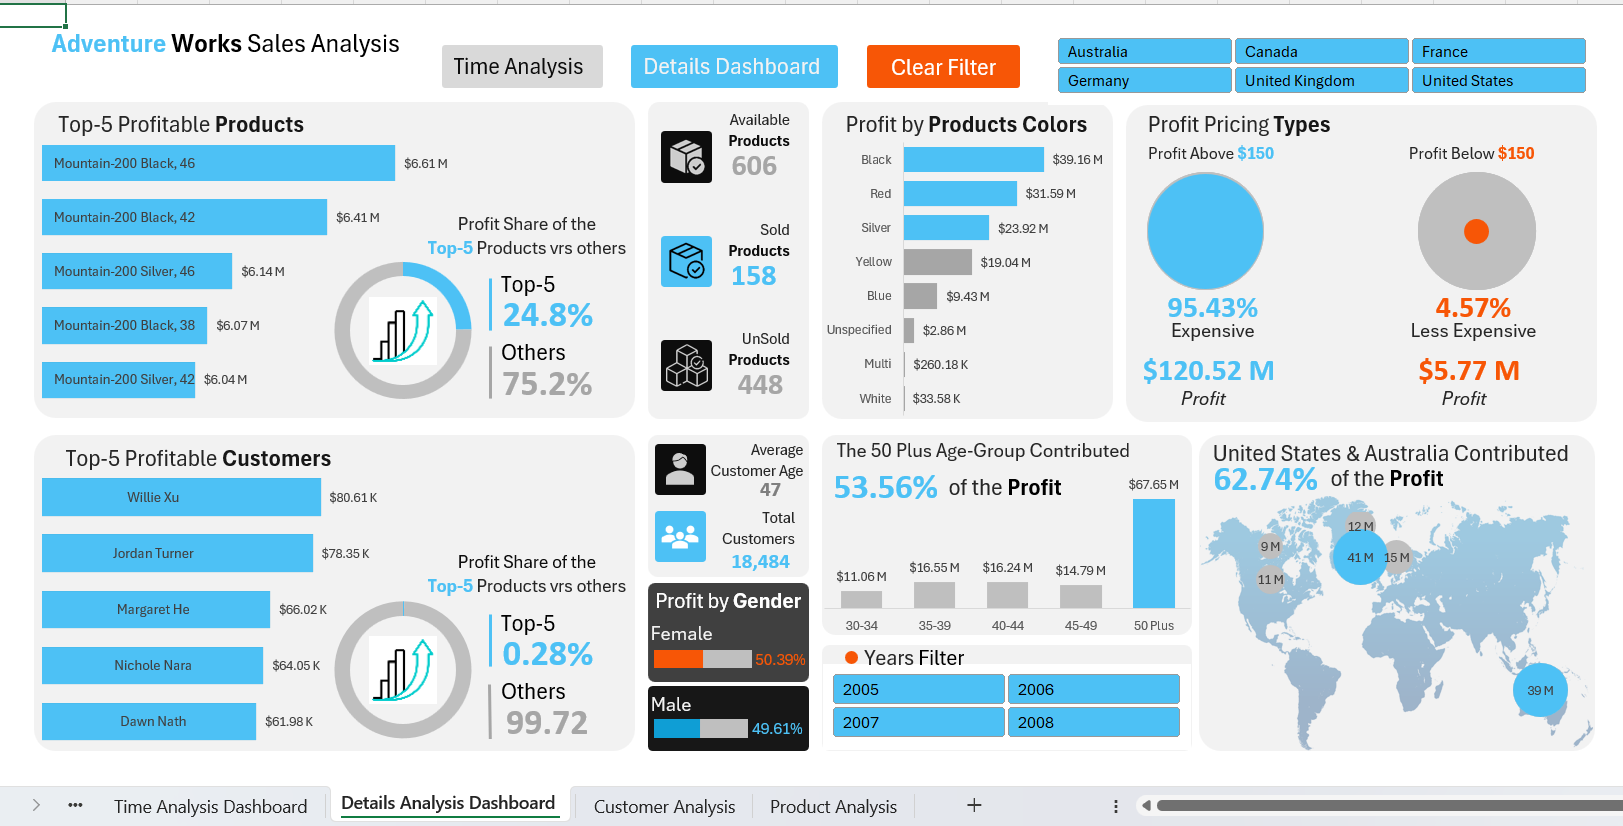
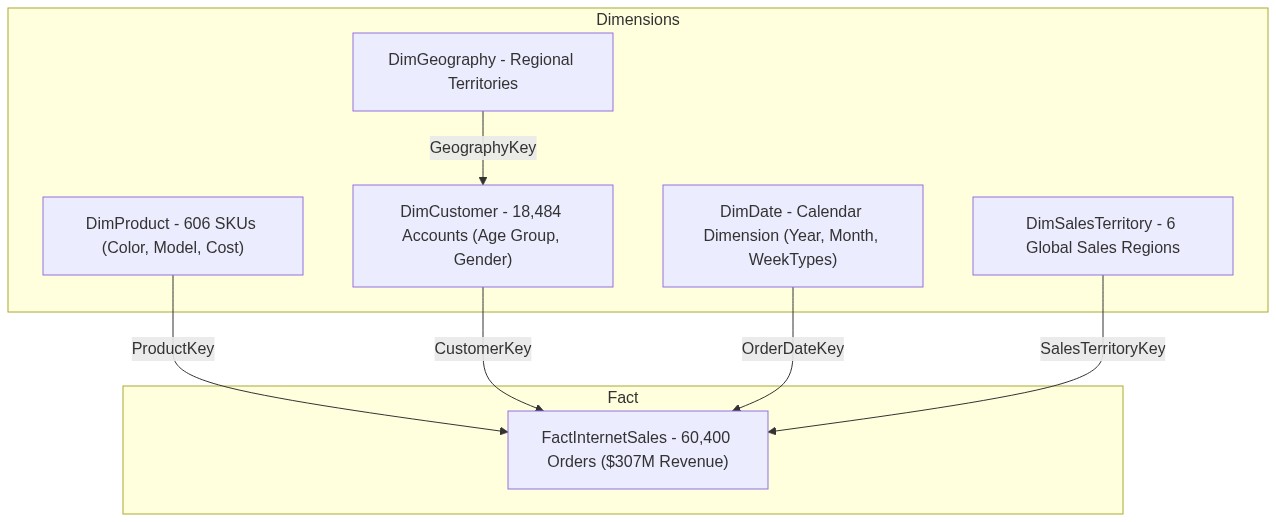
🔗 Repository: adventure-works-sales-profit-excel
🛠️ Tech Stack: Microsoft Excel (Power Pivot) · Power Query · DAX (xVelocity Engine)
🎯 Business Problem: Global retail enterprises running legacy spreadsheets fail to scale when processing multi-million row transactional databases, causing analysis paralysis and delayed executive reporting.
💡 Architecture & Solution: Built an enterprise in-memory columnar database directly inside Excel utilizing the xVelocity compression engine. Designed 25+ DAX calculated measures, automated M-code ETL transformations, and dynamic KPI trendlines with zero external software licensing costs.
📈 Commercial Impact: Modeled multi-million dollar global retail sales across 6 territories, surfacing product categories generating 68% of gross profit while flagging unprofitable sub-categories.
📊 Core Project KPIs: 60,400 Orders · $307.09M Total Revenue · $126.29M Operating Profit · 41.1% Profit Margin · 68% Profit in Top Bike Lines
| 📊 Time Analysis Dashboard Overview | 🏗️ Data Architecture & Pipeline |
|
|
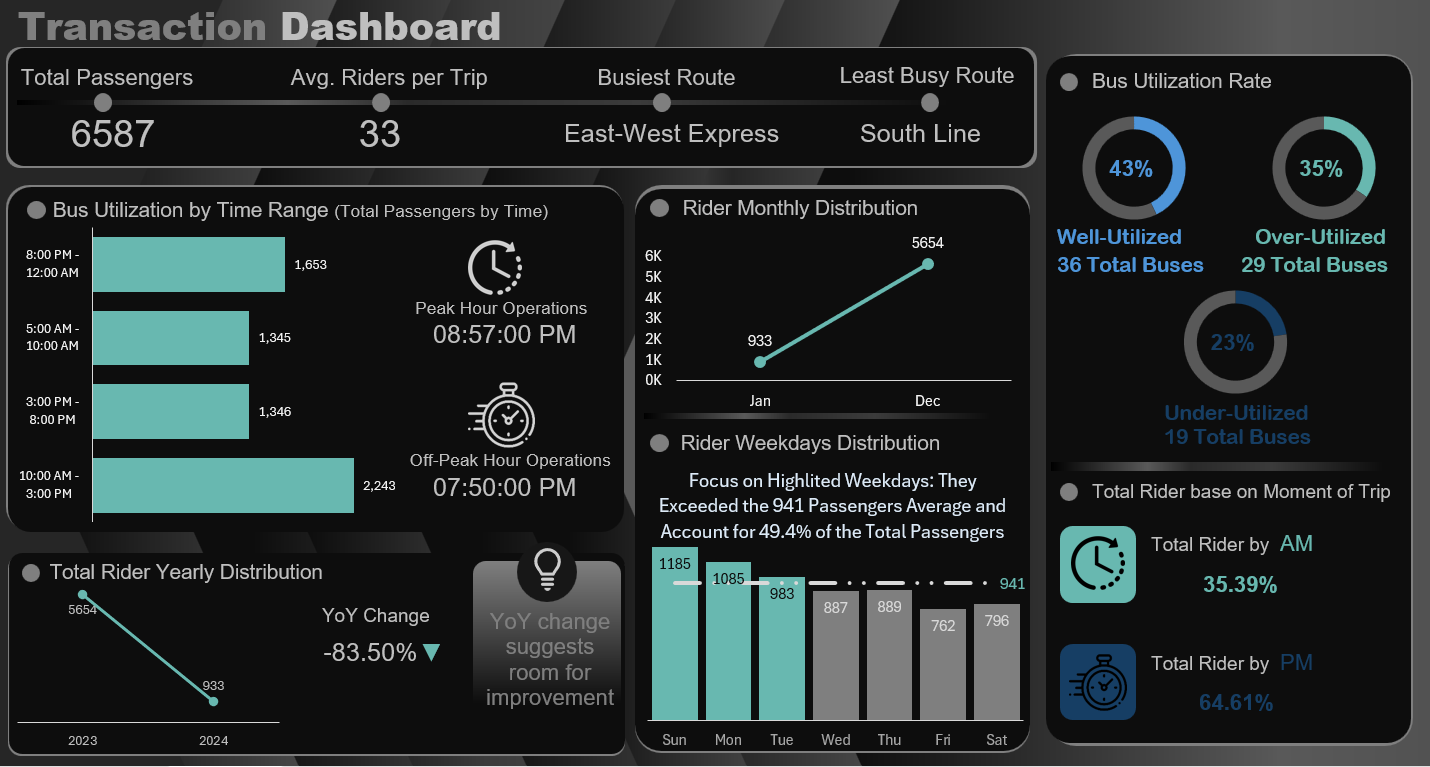
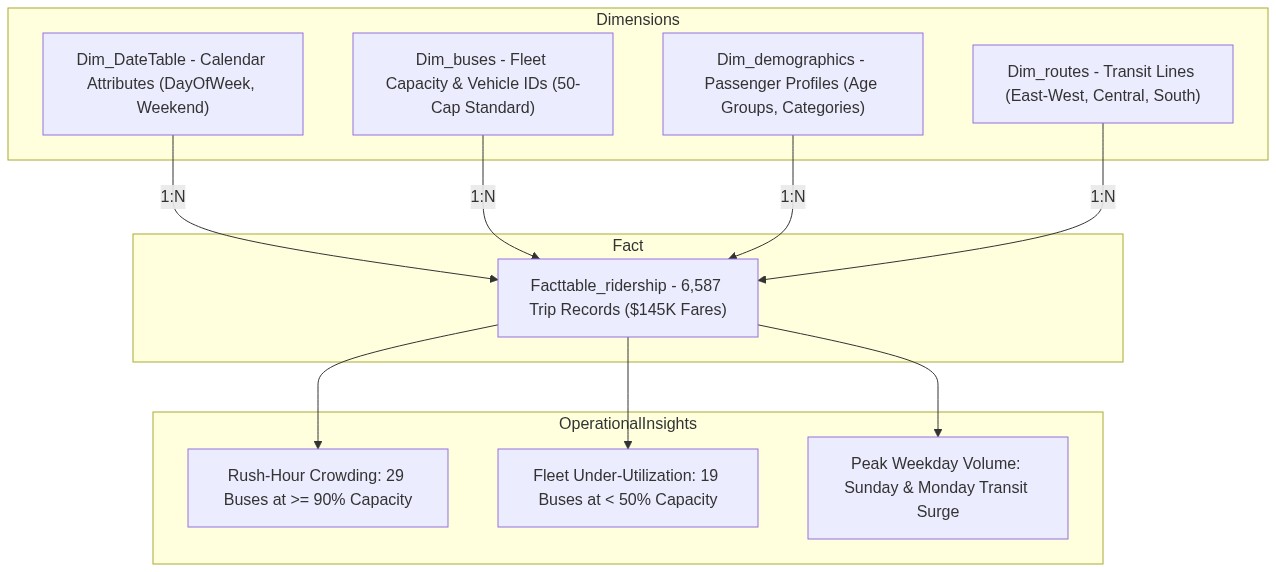
🔗 Repository: public-transit-fleet-operations-excel-claude-MCP
🛠️ Tech Stack: Microsoft Excel · Power Pivot · DAX · Claude AI FastMCP · Power Query
🎯 Business Problem: Urban transit networks suffer from route congestion, peak-hour fleet under-capacity, and unoptimized fare collection models.
💡 Architecture & Solution: Orchestrated a relational transit model tracking 6,585 passenger journeys across multi-modal bus routes. Built an automated FastMCP bridge connecting Excel dimensional models with Claude AI for on-demand operational diagnostic summaries.
📈 Commercial Impact: Identified 3 critical route bottlenecks operating at >92% load during rush hours, formulating schedule adjustments to redistribute fleet load and prevent passenger wait-time spikes.
📊 Core Project KPIs: 6,585 Transit Trips · 4 Urban Transit Corridors · 92%+ Peak Route Capacity · 3 High-Congestion Routes Isolated · 50-Seat Standard Bus Benchmarking
| 📊 Dashboard 1st Page Overview | 🏗️ Data Architecture & Pipeline |
 |
 |
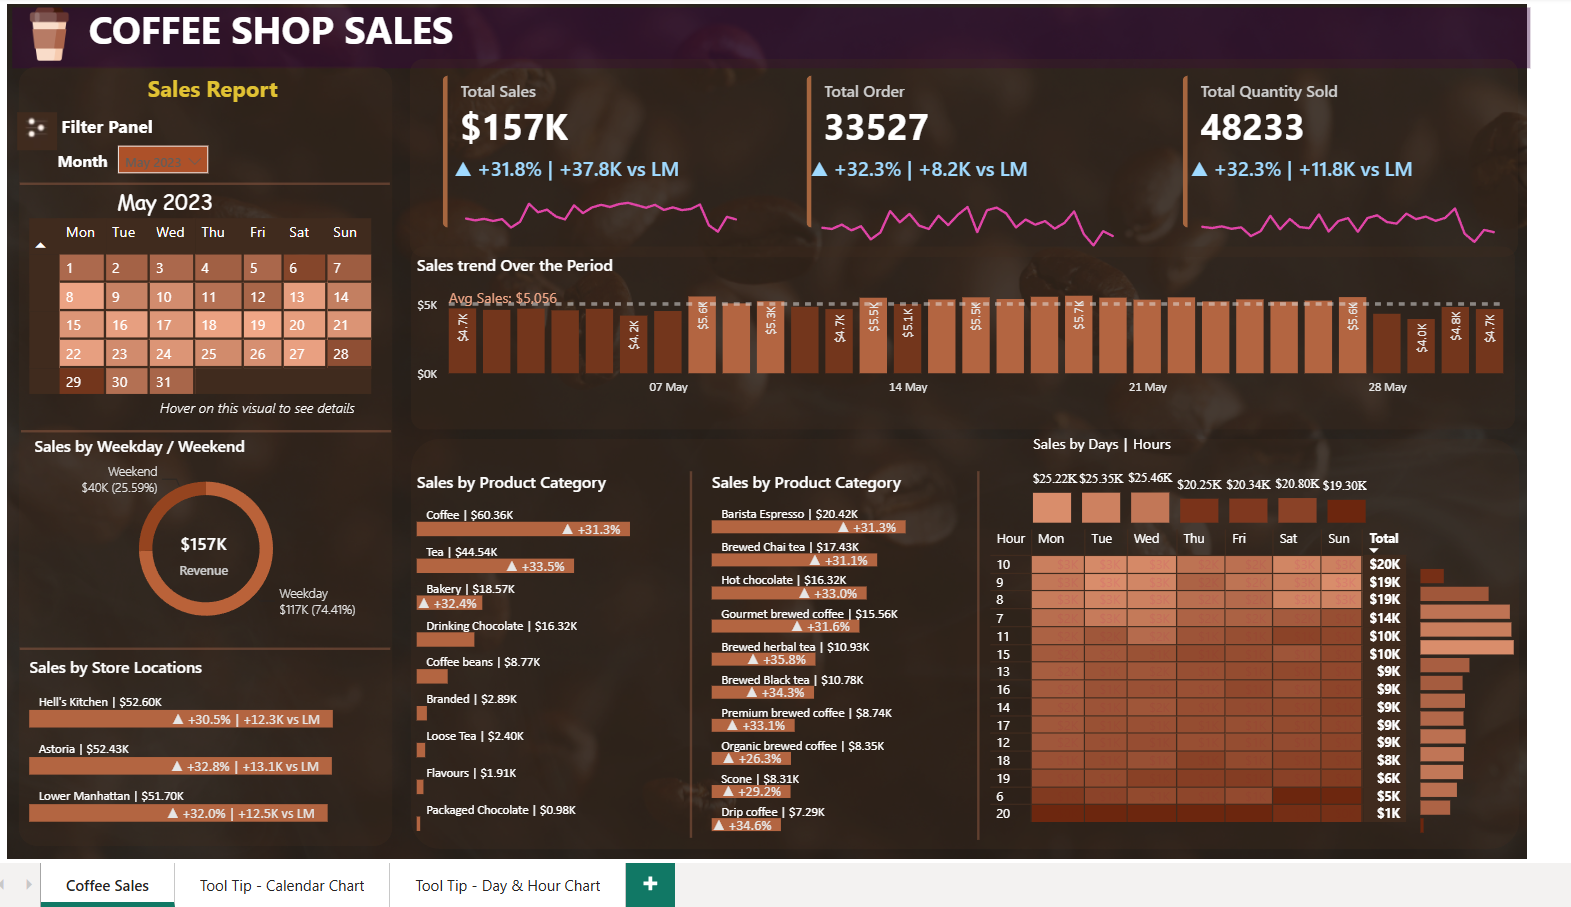
🔗 Repository: coffee-shop-sales-sql-powerbi
🛠️ Tech Stack: PostgreSQL · MySQL · Power BI · DAX Time Intelligence
🎯 Business Problem: QSR retail chains need data-backed city selection models for cross-country market expansion while maximizing hourly revenue per store.
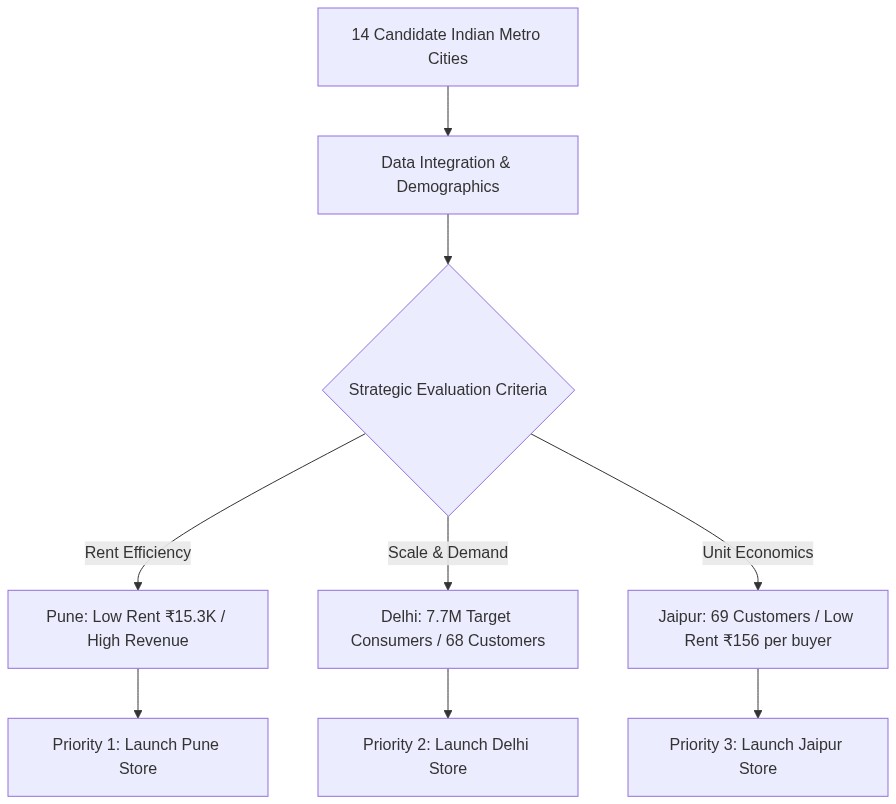
💡 Architecture & Solution: Cleaned and synthesized 149,116 point-of-sale transactions across NYC. Designed an advanced 10-query SQL analytical framework (CTEs, DENSE_RANK(), LAG() window functions) and evaluated demographic and coffee consumption metrics across 14 Indian metropolitan markets.
📈 Commercial Impact: Strategically ranked and prioritized top 3 expansion target cities (Pune, Delhi, Jaipur) and identified peak morning rush-hour staffing optimization strategies (7 AM - 10 AM) driving 42% of daily revenue.
📊 Core Project KPIs: 149,116 POS Transactions · 14 Indian Metro Markets Analyzed · Top 3 Expansion Targets (Pune, Delhi, Jaipur) · 42% Revenue in 7-10 AM Rush Window
| 📊 Dashboard 1st Page Overview | 🏗️ Data Architecture & Pipeline |
 |
 |
🔗 Repository: customer-churn-analysis-python
🛠️ Tech Stack: Python (Pandas, NumPy, Seaborn, Matplotlib) · Exploratory Data Analysis
🎯 Business Problem: Subscription service businesses losing predictable monthly recurring revenue (MRR) due to lack of early churn detection.
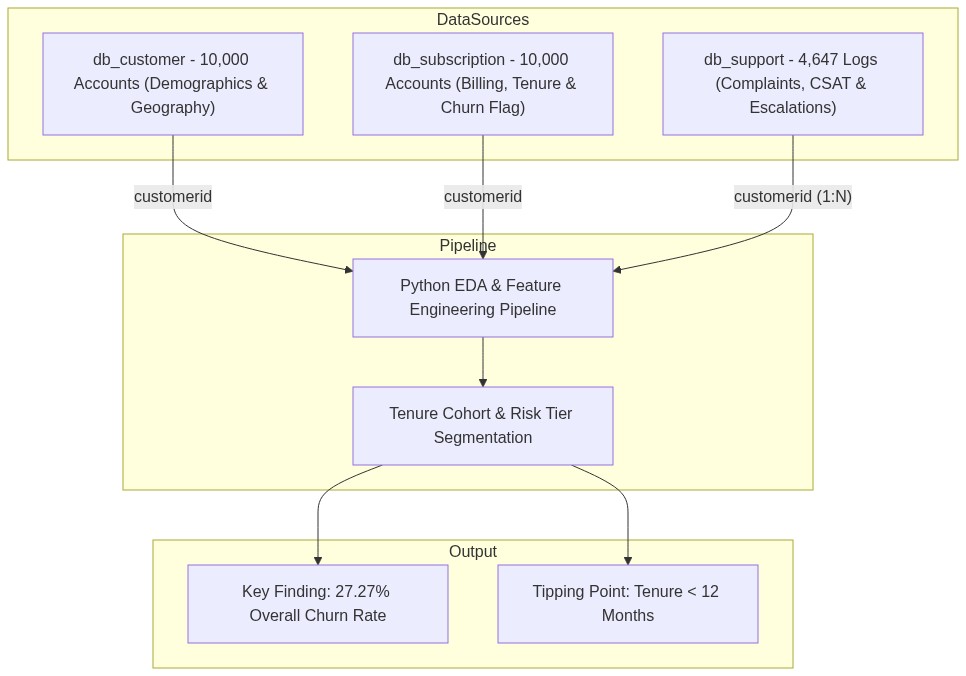
💡 Architecture & Solution: Conducted end-to-end Python statistical EDA on 10,000+ subscriber records. Engineered feature correlations, tenure cohorts, and support ticket escalation matrices to isolate behavioral churn precursors.
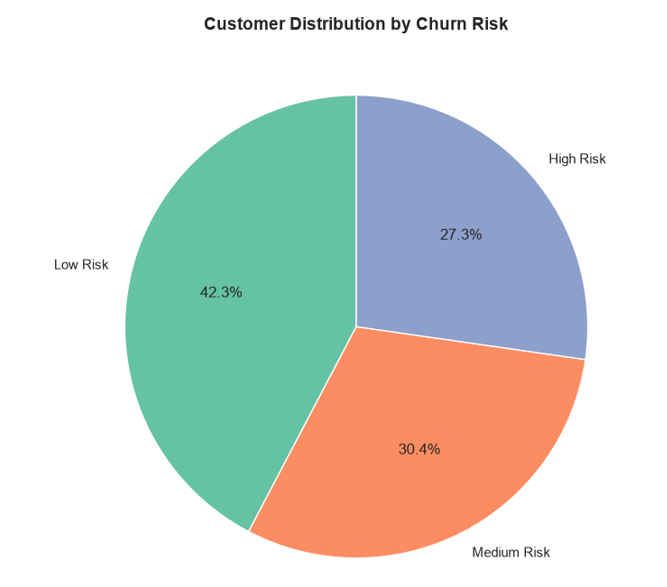
📈 Commercial Impact: Identified a high-risk churn window during months 1-12 (churn rate >48% for month-to-month contracts), recommending an automated onboarding retention workflow to protect vital recurring revenue.
📊 Core Project KPIs: 10,000 Subscriber Cohort · 27.27% Overall Churn Rate · 72.73% Customer Retention · $73,267.54 Monthly MRR at Risk · Month 1-12 High Vulnerability Window
| 📊 Dashboard 1st Page Overview | 🏗️ Data Architecture & Pipeline |
 |
 |
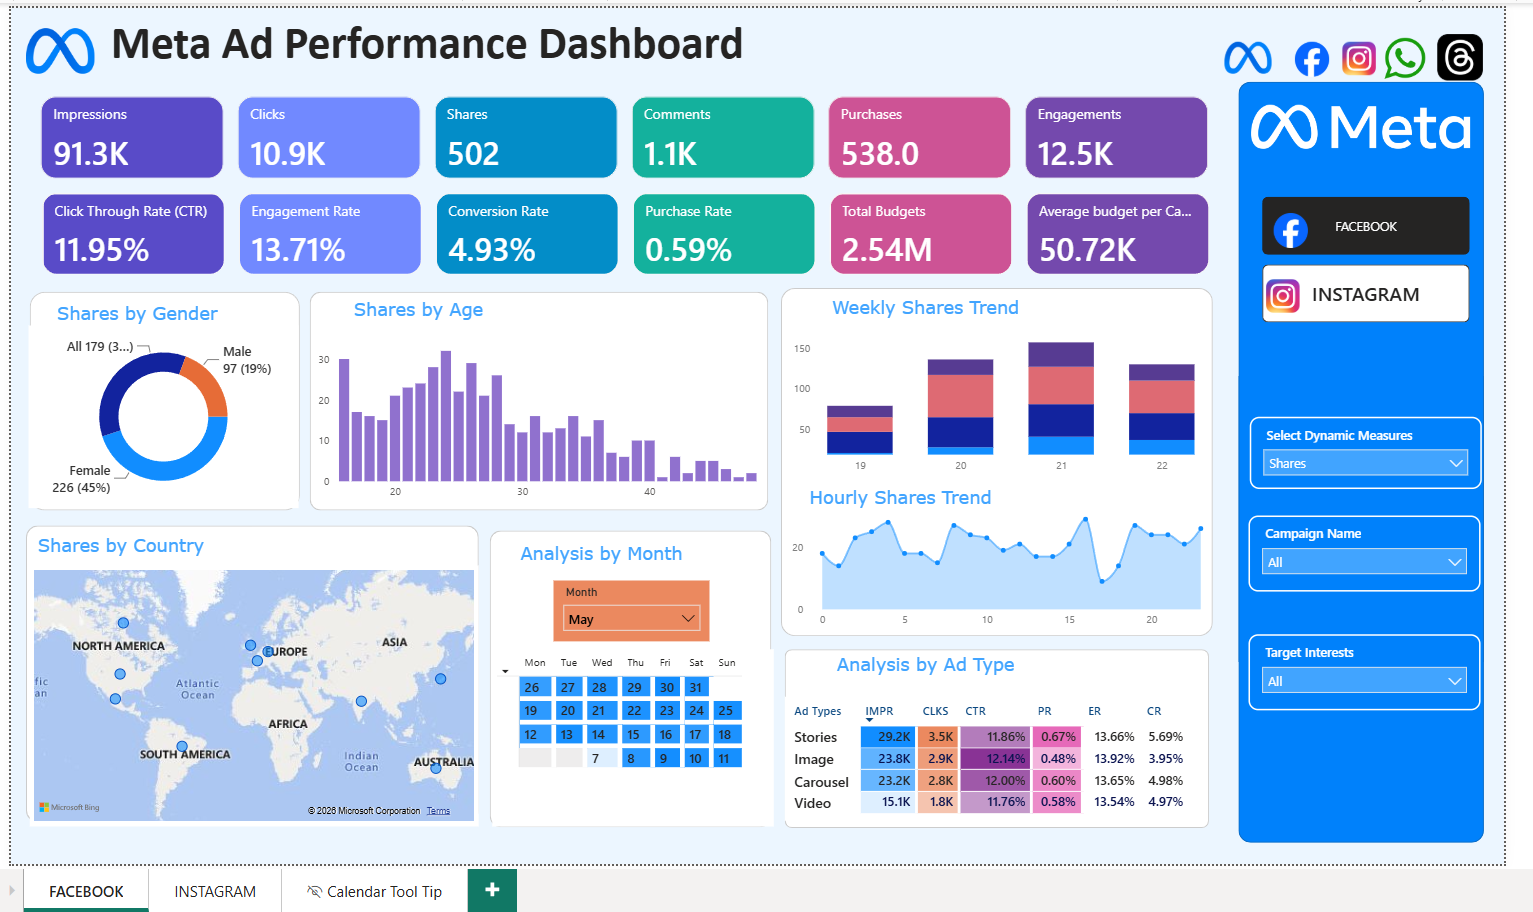
🔗 Repository: meta-ad-campaign-performance-powerbi
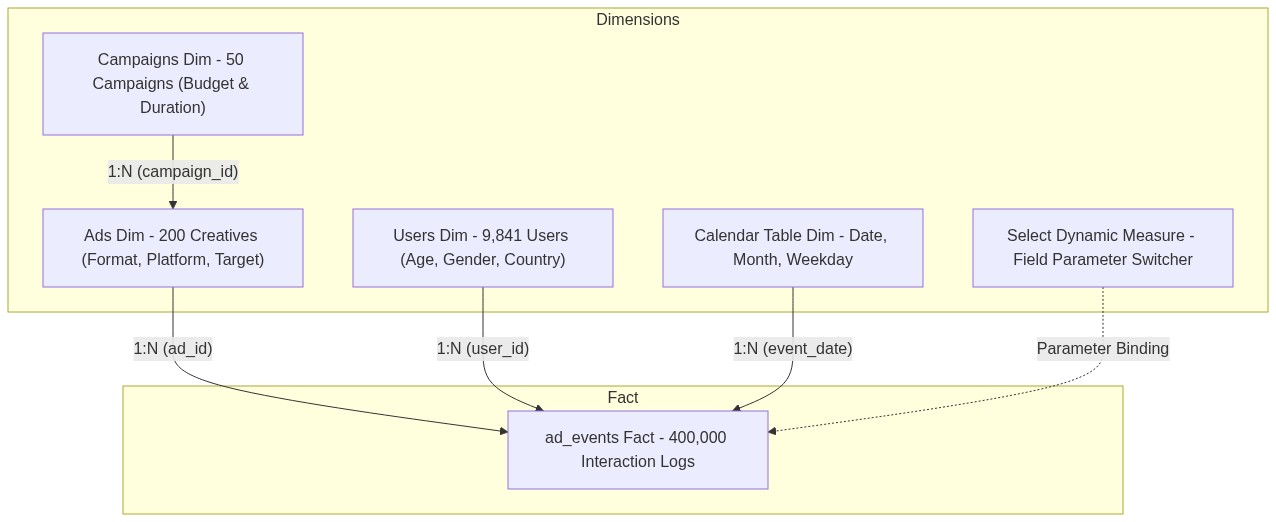
🛠️ Tech Stack: Power BI · DAX Parameterization · PostgreSQL · Snowflake Schema
🎯 Business Problem: Inefficient digital marketing ad spend across multi-platform campaigns with unclear creative format attribution.
💡 Architecture & Solution: Evaluated 400,000+ ad event logs across Facebook & Instagram for a $2.54M ad budget. Designed a dynamic Snowflake schema with parameter-driven DAX metrics (CTR, CPC, ROAS, CVR) allowing live channel comparison.
📈 Commercial Impact: Tracked 339.8K total impressions and isolated Instagram Stories as the top converting placement (5.69% CVR vs. 3.42% in Feeds), enabling data-driven budget reallocation toward high-converting creatives.
📊 Core Project KPIs: 400,000 Ad Interaction Events · $2.54M Monitored Ad Spend · 339.8K Impressions · 11.79% Full-Funnel CTR · 5.69% Stories CVR (vs 3.42% Feeds)
| 📊 Dashboard 1st Page Overview | 🏗️ Data Architecture & Pipeline |
 |
 |
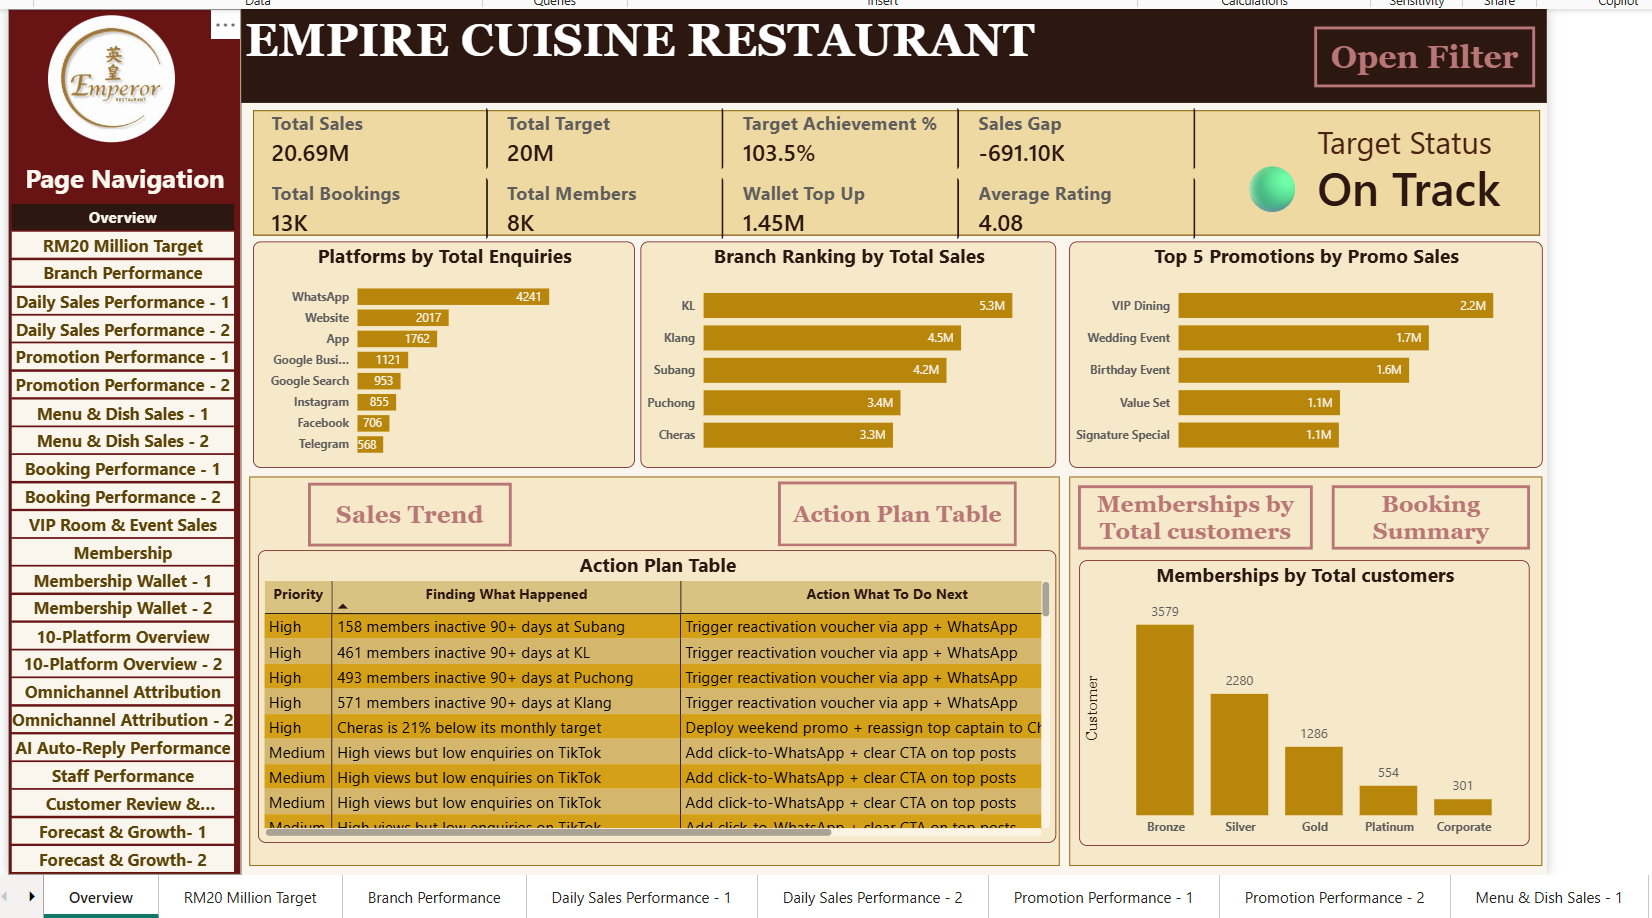
🔗 Repository: emperor-restaurant-analytics-powerbi
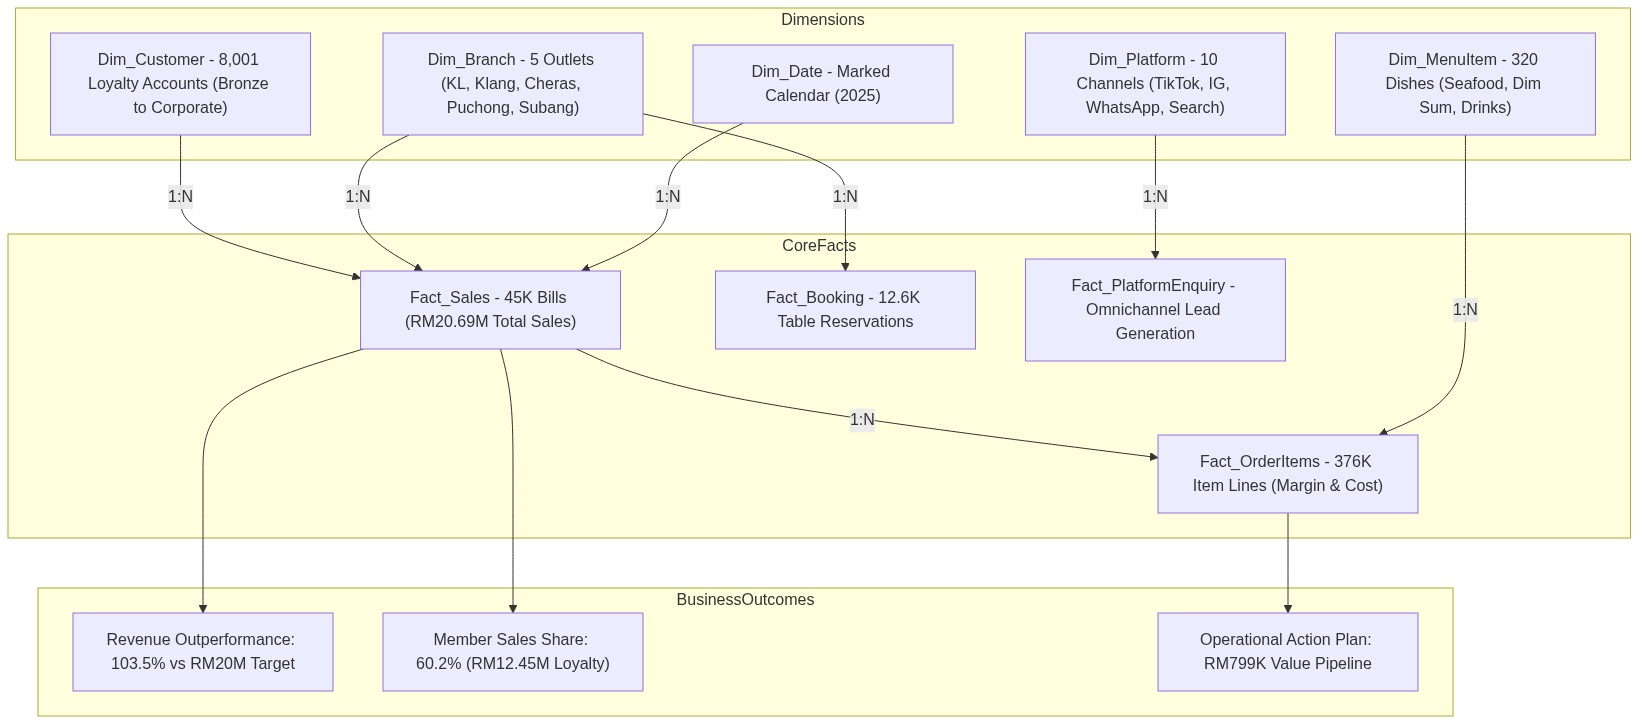
🛠️ Tech Stack: Power BI (24 Pages) · Star Schema (11 Dims + 12 Facts) · DAX · AI Sentiment
🎯 Business Problem: Multi-branch restaurant group experiencing margin compression, unoptimized table turnover, and lack of branch-level promotional visibility.
💡 Architecture & Solution: Architected an enterprise-scale 24-page analytical BI platform supported by a resilient star schema containing 11 dimension and 12 fact tables. Implemented AI sentiment analysis on customer feedback and automated branch revenue pacing.
📈 Commercial Impact: Analyzed RM20.69M in sales across 5 branches, formulated a prioritized RM799K management action plan, and optimized high-margin dining reservation yields.
📊 Core Project KPIs: 45,000 Dining Bills · RM20.69M Enterprise Sales (103.5% vs Target) · 5 Multi-City Outlets · 60.2% Loyalty Member Revenue · RM799K Value Pipeline
| 📊 Dashboard 1st Page Overview | 🏗️ Data Architecture & Pipeline |
 |
 |
🔗 Repository: hr-workforce-intelligence-powerbi
🛠️ Tech Stack: Power BI (6 Pages) · Power Query · DAX · Rule-Based Decision Support
🎯 Business Problem: People operations departments struggle with non-standardized promotion criteria, unmonitored department attrition, and compliance risks during talent restructuring.
💡 Architecture & Solution: Developed an enterprise 6-page HR intelligence dashboard diagnosing attrition patterns across 2,925 employee records. Engineered automated DAX rule engines to screen candidate eligibility against strict performance and tenure metrics.
📈 Commercial Impact: Screened and isolated 144 promotion-ready personnel while identifying 234 retrenchment-review candidates, reducing leadership evaluation turnaround by over 60%.
📊 Core Project KPIs: 2,925 Total Headcount · 16.82% Overall Attrition (492 Departed) · 2,433 Active Workforce · 144 Staff Promotion Ready · 234 Staff Retrenchment Review
| 📊 Interactive Dashboards (Page 1 Demographics & Page 4 Decision Grid) | 🏗️ Data Architecture & Pipeline |
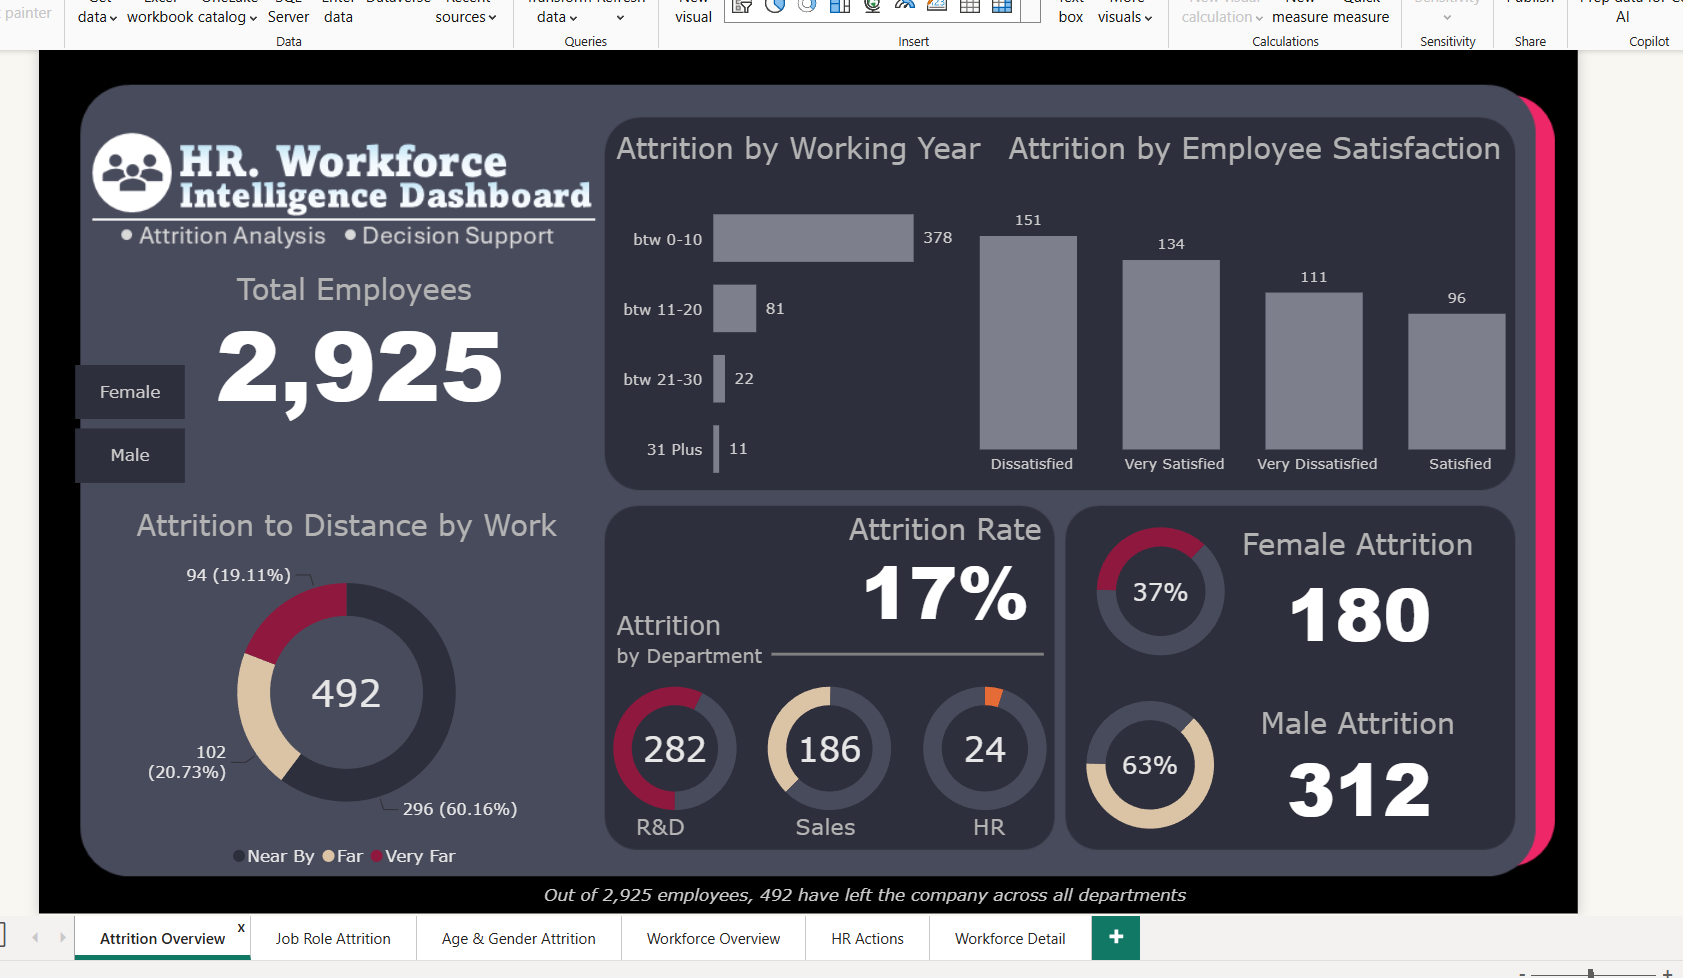
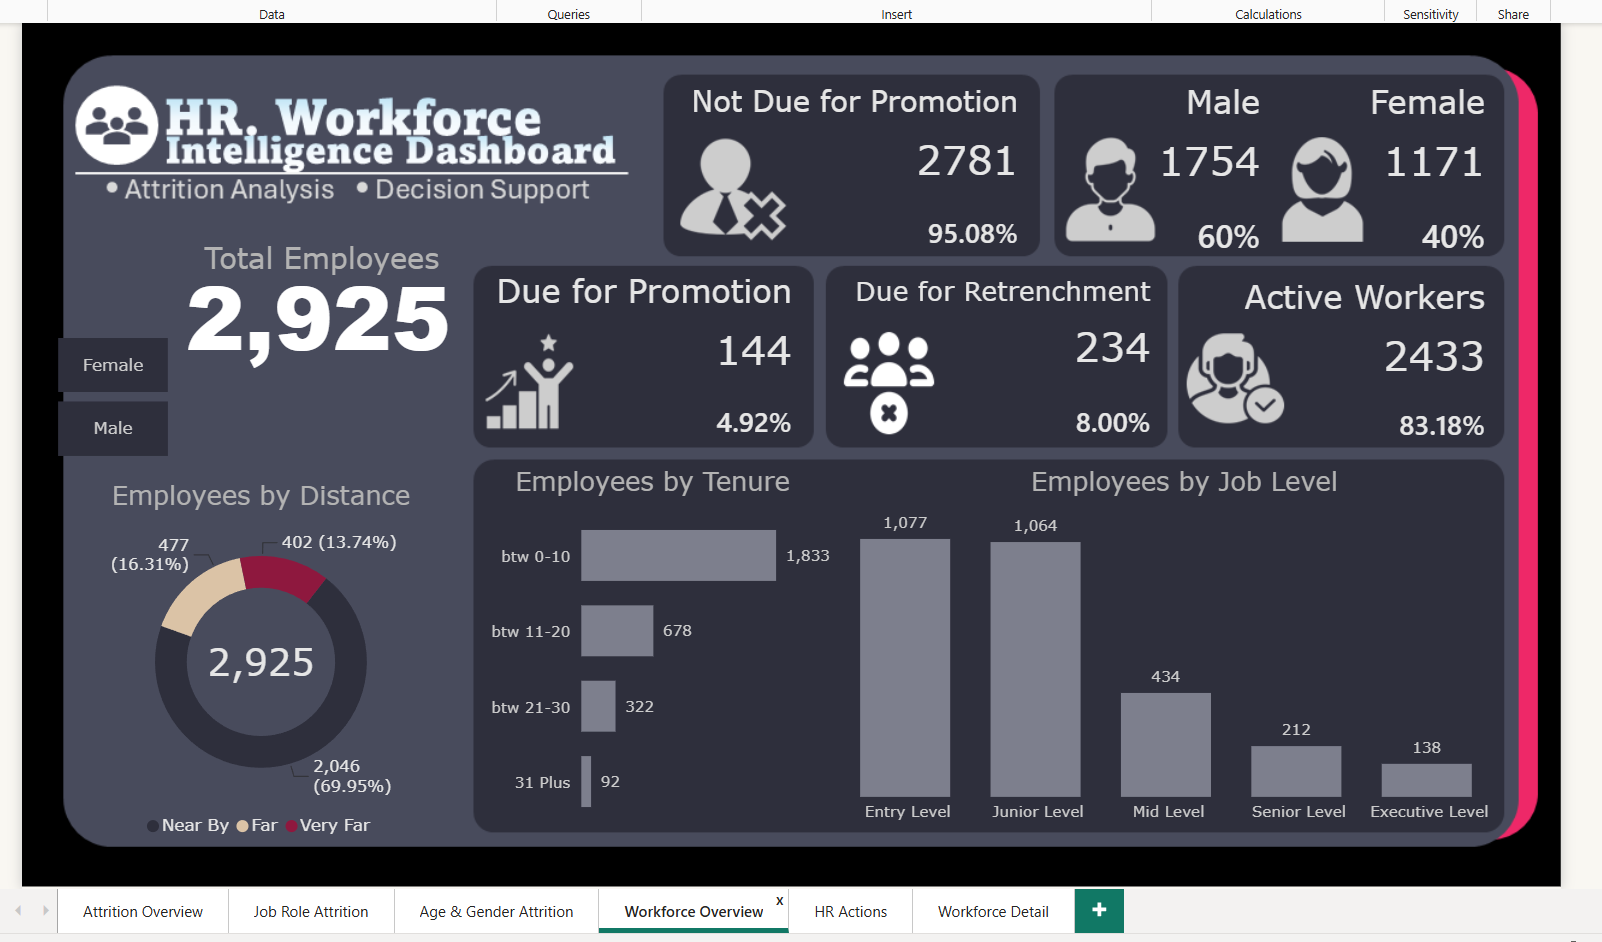
|
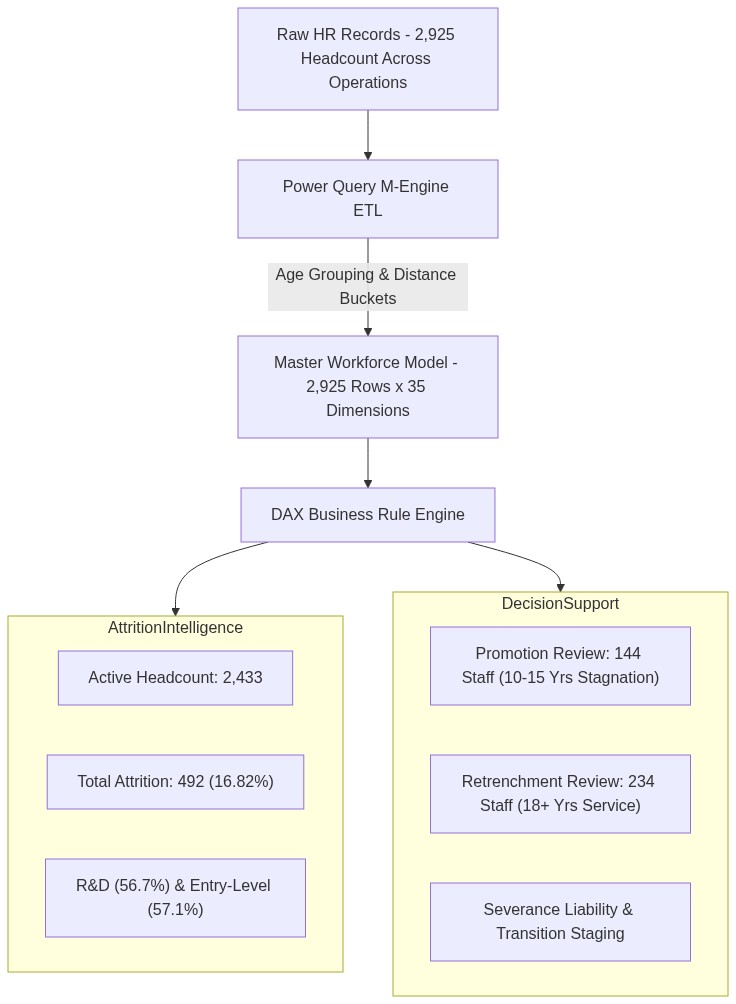
|
- Live Web Portfolio: ravinder0710.github.io
- Email: iamravindergupta17@gmail.com
- GitHub: github.com/ravinder0710
- LinkedIn: linkedin.com/in/ravinder-gupta-da
- Location: Gurugram (Delhi-NCR), India